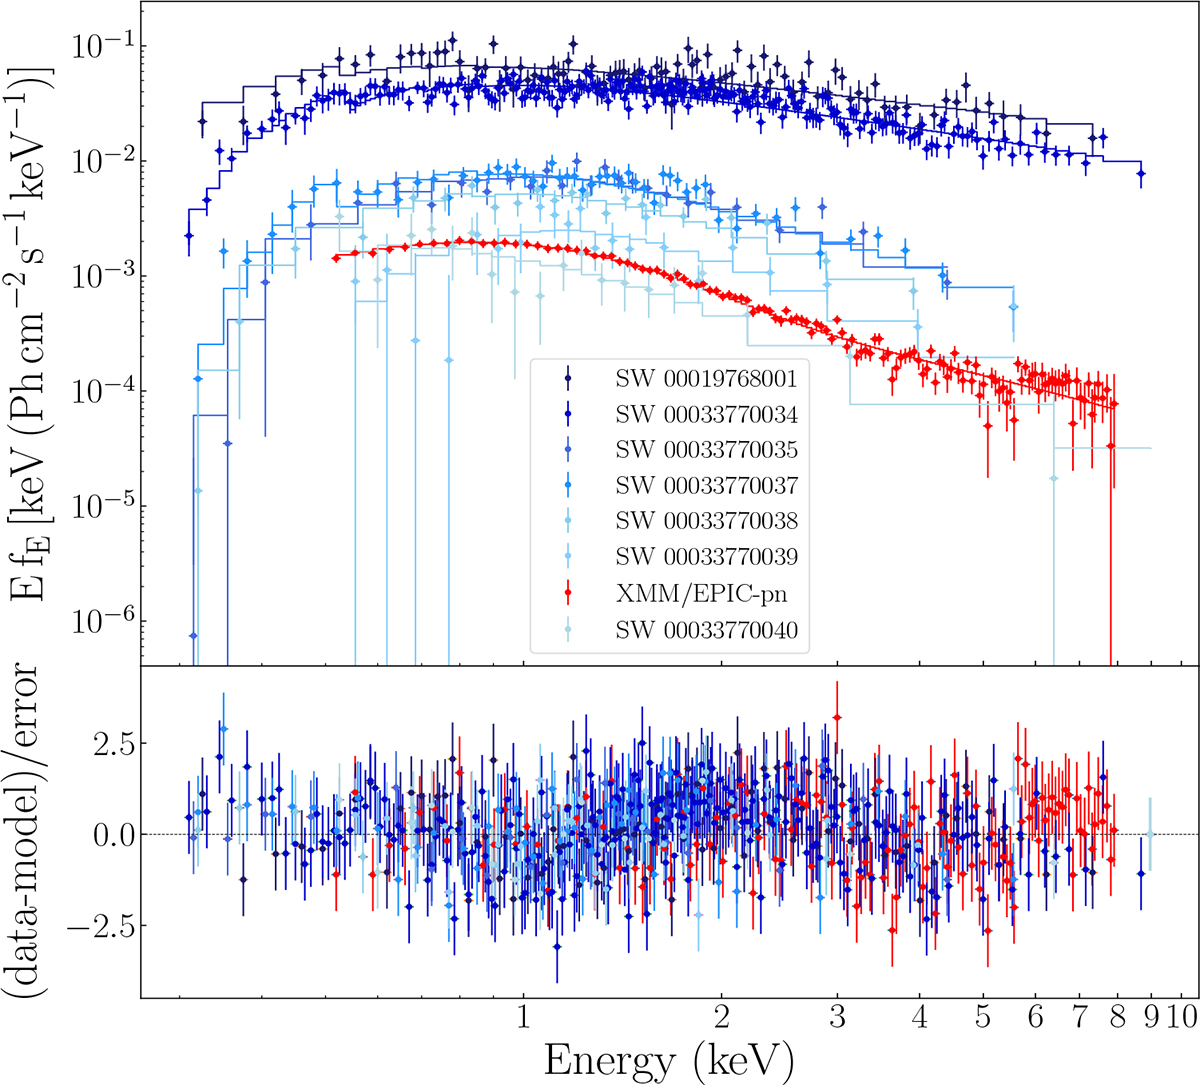
Fig. 5.
Download original image
Top: Unfolded average spectrum of the persistent emission from MAXI J1957+032. The blue curves represent Swift/XRT spectra, from the earliest observation (darkest blue) to the latest (lightest blue), fitted with the TBabs*powerlaw model (see Sect. 3.2.2). In the legend, Swift/XRT observations are labelled ‘SW’ followed by their Obs. ID (see Table A.1). The red curve shows the XMM-Newton/PN spectrum, fitted with TBabs*(thComp*bbodyrad) (see Sect. 3.2.1). Bottom: Residuals with respect to the adopted models.
Current usage metrics show cumulative count of Article Views (full-text article views including HTML views, PDF and ePub downloads, according to the available data) and Abstracts Views on Vision4Press platform.
Data correspond to usage on the plateform after 2015. The current usage metrics is available 48-96 hours after online publication and is updated daily on week days.
Initial download of the metrics may take a while.