Fig. 2.
Download original image
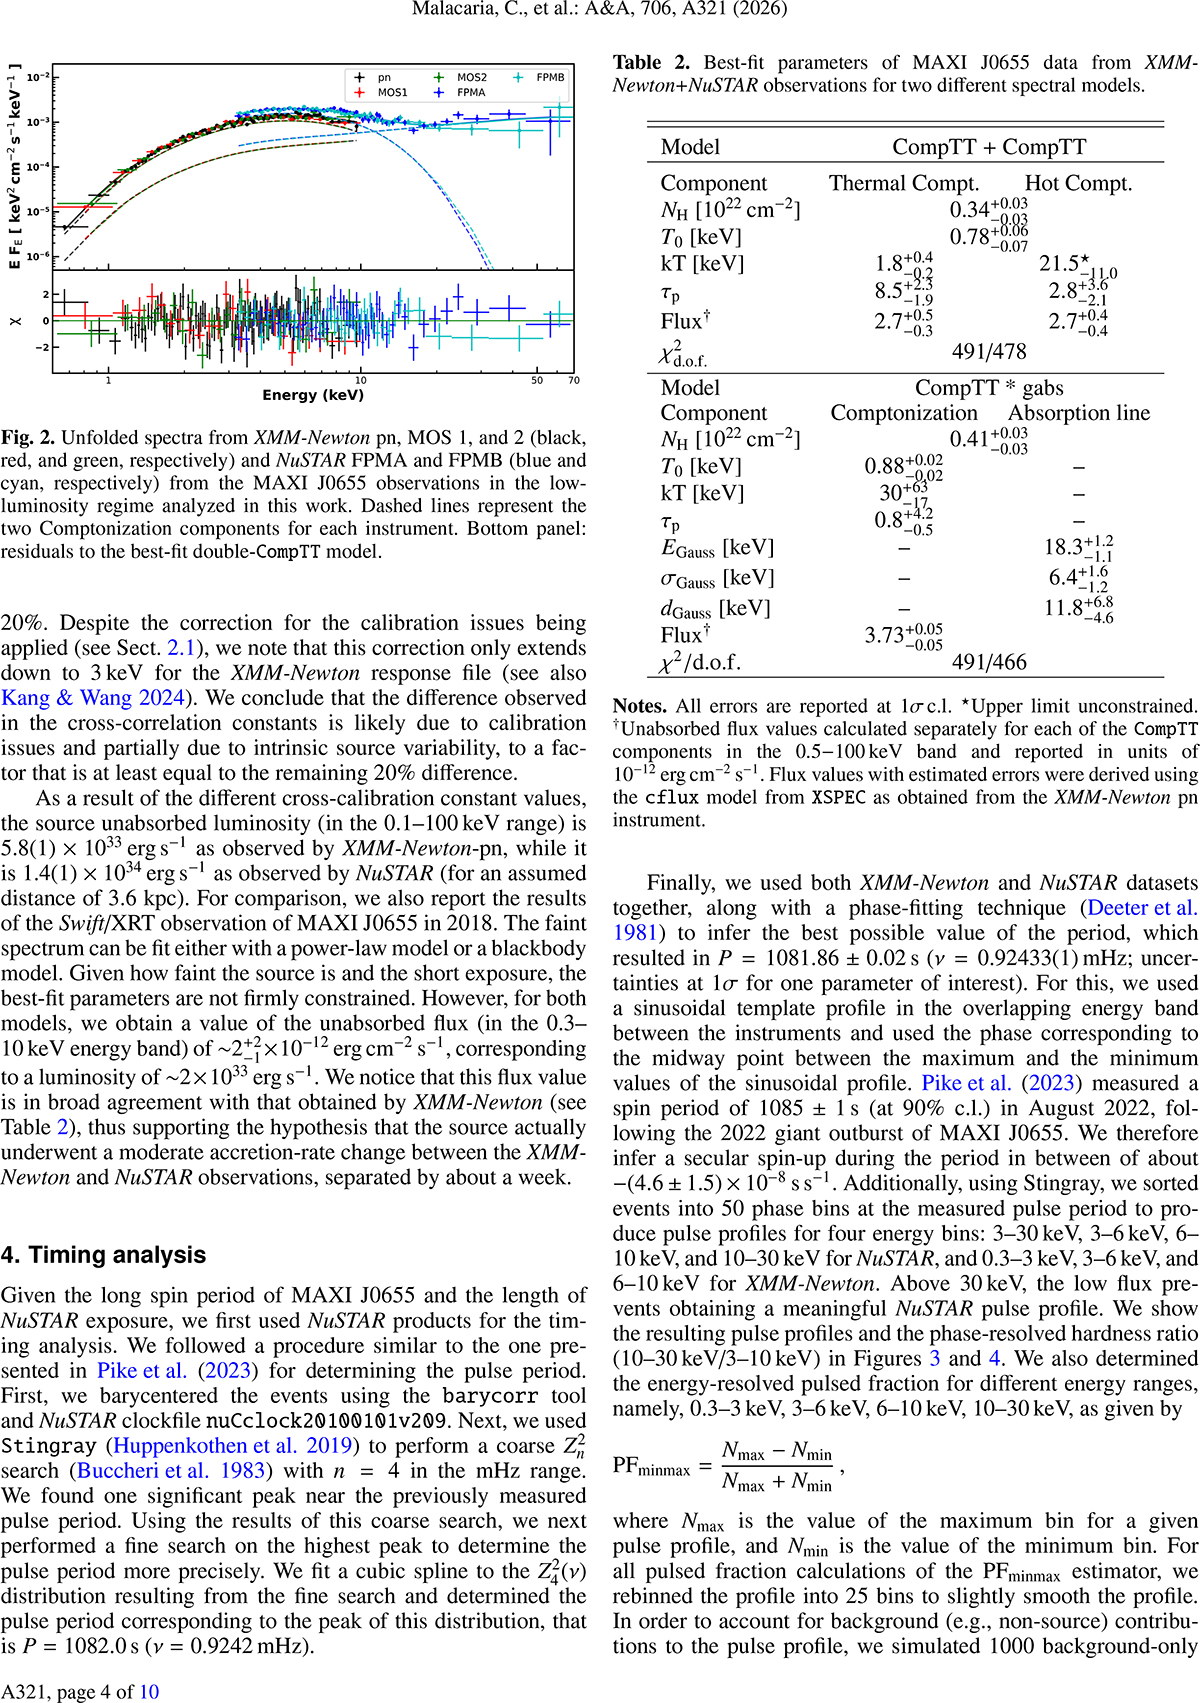
Unfolded spectra from XMM-Newton pn, MOS 1, and 2 (black, red, and green, respectively) and NuSTAR FPMA and FPMB (blue and cyan, respectively) from the MAXI J0655 observations in the low-luminosity regime analyzed in this work. Dashed lines represent the two Comptonization components for each instrument. Bottom panel: residuals to the best-fit double-CompTT model.
Current usage metrics show cumulative count of Article Views (full-text article views including HTML views, PDF and ePub downloads, according to the available data) and Abstracts Views on Vision4Press platform.
Data correspond to usage on the plateform after 2015. The current usage metrics is available 48-96 hours after online publication and is updated daily on week days.
Initial download of the metrics may take a while.