| Issue |
A&A
Volume 706, February 2026
|
|
|---|---|---|
| Article Number | A92 | |
| Number of page(s) | 16 | |
| Section | Extragalactic astronomy | |
| DOI | https://doi.org/10.1051/0004-6361/202557876 | |
| Published online | 03 February 2026 | |
The binary ballet: Mapping local expansion around M 81 and M 82
1
Helsinki Institute of Physics P.O. Box 64 FI-00014 University of Helsinki, Finland
2
Academia Sinica Institute of Astronomy and Astrophysics, 11F of AS/NTU Astronomy-Mathematics Building Roosevelt Rd Taipei 106216, Taiwan, R.O.C.
3
Bahamas Advanced Study Institute and Conferences, 4A Ocean Heights, Hill View Circle Stella Maris Long Island, The Bahamas
4
Leibniz-Institut für Astrophysik Potsdam (AIP) An der Sternwarte 16 D-14482 Potsdam, Germany
5
Special Astrophysical Observatory, Russian Academy of Sciences, Nizhny Arkhyz Karachai-Cherkessian Republic 369167, Russia
★ Corresponding authors: This email address is being protected from spambots. You need JavaScript enabled to view it.
; This email address is being protected from spambots. You need JavaScript enabled to view it.
; This email address is being protected from spambots. You need JavaScript enabled to view it.
Received:
28
October
2025
Accepted:
13
December
2025
Abstract
This study of the M 81 complex and its Hubble flow delivers new and improved tip of the red giant branch (TRGB)-based distances for nine member galaxies, yielding a total of 58 galaxies with high-precision TRGB distances. With those, we perform a systematic analysis of the group’s dynamics in the core and its embedding in the local cosmic environment. Our analysis confirms that the satellite galaxies of the M 81 complex exhibit a flattened, planar distribution almost perpendicular to the supergalactic pole, and thus aligned with a larger-scale filamentary structure in the local Universe. We demonstrate that the properties of the group’s barycentre are robustly constrained by the two brightest members, M 81 and M 82, and that correcting heliocentric velocities for the solar motion in the Local Group decreases the velocity dispersion of the group. Then applying minor and major infall models, we fit the local Hubble flow to constrain the Hubble constant and the total mass of the M 81 complex. The joint best-fit parameters from both models yield H0 = (63±6) km/s/Mpc and a total mass of (2.28 ± 0.49)×1012 M⊙. We thus arrive at an increased mass estimate compared to prior work but reach a higher consistency with virial ((2.74 ± 0.36)×1012 M⊙) and projected ((3.11 ± 0.69)×1012 M⊙) mass estimates. Moreover, our H0 estimate shows an agreement with Planck, consistent with other TRGB-based local-Universe inferences of H0 and still within a 2σ agreement with Cepheid-based local-Universe probes.
Key words: galaxies: groups: individual: M 81 / cosmological parameters
© The Authors 2026
 Open Access article, published by EDP Sciences, under the terms of the Creative Commons Attribution License (https://creativecommons.org/licenses/by/4.0), which permits unrestricted use, distribution, and reproduction in any medium, provided the original work is properly cited.
This article is published in open access under the Subscribe to Open model. This email address is being protected from spambots. You need JavaScript enabled to view it. to support open access publication.
1. Introduction
The M 81 galaxy complex stands as one of the most prominent and massive groups in the nearby Universe, providing a critical laboratory for studying galaxy interactions, group dynamics, and the small-scale properties of the Hubble flow (Karachentsev & Kashibadze 2006, 2021). Our study introduces previously unmeasured and improved tip of the red giant (TRGB)-based distances for nine galaxies: M 82, d0944+71, KDG 73, UGC 4483, DDO 53, dw0959+68, HolmII, KKH37, and UGC 6456. Among these, the distance to M 82 is particularly vital for dynamically determining the group’s centre of mass, while galaxies like HolmII and UGC 6456, located at distances exceeding 1 Mpc from M 81, provide crucial anchors in the Hubble flow regime. This comparably homogeneous TRGB-based sample is supplemented by seven additional galaxies (JKB83, KDG61em, Clump I, Clump III, HIJASS1021+68, UGC 6451, and SMDG0956+82) with distances newly inferred from other methods; the first six are based on associations with neighbouring members, while the last, SMDG0956+82, relies on the numerical action method (NAM) and is consequently too uncertain for our primary analysis despite its location beyond 1 Mpc. Moreover, the first four are emission sparks that do not contain old stellar populations and HIJASS1021+68 is a starless HI cloud, such that the TRGB-approach cannot be applied to these galaxies.
With this extended and improved dataset based on the Catalog and Atlas of Local Volume Galaxies (see Karachentsev et al. (2013) and references therein), we performed a systematic analysis to determine the position and line-of-sight velocity of the group’s centre of mass, employing the four brightest central galaxies (M 81, M 82, NGC 3077, and NGC 2976), finding that M 81 and M 82 alone are sufficient to robustly constrain these properties. We then used all 58 galaxies with precise TRGB-based distances to constrain the Hubble constant, H0, and the total enclosed mass of the M 81 complex, M, through a detailed Hubble flow analysis. This included a thorough investigation of the impact of key nuisance parameters on the final inferred cosmological and dynamical parameters. Most prominently, these nuisance parameters are the correction of the solar motion in the Local Group and the chosen starting and ending distances for the Hubble flow fit. With our systematic analyses of the local expansion field using all galaxies with TRGB-based distances available, this study provides new, precise benchmarks for testing cosmological models on small scales and for understanding the mass assembly of a major galaxy group in a filamentary embedding.
The paper is organised as follows. Sect. 2 describes the characteristics of the dataset and compares it to the one previously used in Müller et al. (2024) and Wagner & Benisty (2025). Sect. 3 discusses the embedding of the M 81 complex into the local cosmic environment. Sect. 4 presents infall models to estimate the radial velocities of galaxies relative to the group’s barycentre and also details the pre-processing of the measurements to apply these models, in particular the bias correction to the heliocentric velocities and the determination of the group’s barycentre. Then, Sect. 5 details the Hubble flow fitting function and approaches to constrain H0 and M from our data. Sect. 6 compares the mass estimates from the Hubble flow fit with complementary dynamical mass estimators. Finally, Sect. 7 summarises our results and puts them into the context of prior works and the role of local-Universe Hubble flow fits for the H0 tension.
2. Dataset
2.1. Dataset description
The total dataset contains 98 galaxies around M 81 and in its embedding environment. Of those, 26 do not have velocity measurements and are excluded from the analysis. Out of the remaining 72 galaxies, 58 have TRGB-based distances, 6 distances were obtained by applying the NAM to galaxies having TRGB-based distances and inferring the distance from the reconstructed dynamical field, as is detailed in Shaya et al. (2017) and Kourkchi et al. (2020), 6 distances were obtained from the galaxy membership in known groups with measured distances of other members (mem), 1 distance was obtained by surface brightness fluctuations (SBF), and 1 distance was obtained based on the texture (txt), i.e. the granular structure of the galaxy (see also Karachentsev et al. (2013) for details). All methods are subject to various calibrations and physical mechanisms, so that their observational uncertainties differ. We assume 5% uncertainties on the TRGB-based distances and estimate the other methods to be 25–30% imprecise.
Fig. 1 shows a histogram of distances around M 81 for all distance measures (black bars) and TRGB-based distances only (red bars) using a binning of 0.25 Mpc. As can be read off this plot, the 58 galaxies that have TRGB-based distances are sufficient to enable us to perform a Hubble flow analysis and we can exclude galaxies with less precise distance measurements from the analysis.
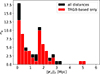 |
Fig. 1. Histogram of distances for all 71 galaxies with respect to M 81 as the centre (black bars) and only those 57 galaxies that have TRGB-based distances (red bars). The bin size is 0.25 Mpc. |
These 58 galaxies with TRGB-based distances were then grouped by finding their ‘major disturber’ (MD), meaning the closest neighbouring galaxy that exerts the maximum tidal impact on the galaxy, as was detailed in Karachentsev & Makarov (1999). The ‘tidal index’, Θ1, for a galaxy, j, to quantify this impact and determine the MD is given by
 (1)
(1)
in which Mk denotes the mass of the k-th neighbouring galaxy and ‖rjk‖2 denotes the three-dimensional distance between galaxy j and k. The constant, C, was chosen such that Θ1 = 0 implies that galaxy j lies exactly at the zero-velocity surface of its MD, if the orbit of galaxy j around its MD is Keplerian. Thus, Θ1 ≥ 0 implies that galaxy j is most likely bound to its MD, while Θ1 < 0 means that galaxy j is unbound, as was also detailed in Karachentsev & Makarov (1999) and Karachentsev et al. (2013).
 |
Fig. 2. Locations of the 72 galaxies that have velocity measurements: physical positions in supergalactic co-ordinates in the SGX-SGY-plane (left), SGX-SGZ-plane (centre), and SGY-SGZ-plane (right). Galaxies in the environment are marked as ‘field’ (grey pluses), galaxies for which M 81, M 82, NGC 3077, or NGC 2976 is the major disturber are summarised under ‘M 81 complex’ (black dots), the galaxy attributed to Holm II as its major disturber and Holm II itself are called the ‘HolmII system’ (red xs), and NGC 2403 and two satellites galaxies are called the ‘N2403 system’ (yellow squares). M 81, Holm II, and NGC 2403 are additionally highlighted by green stars. Larger symbols indicate galaxies that have Θ1 < 0 and are thus unbound. |
Grouping the 58 galaxies can now be performed by noting that the six brightest galaxies in the B band are M 81, NGC 2403, M 82, NGC 3077, NGC 2976, and Holm II, with M 81, M 82, NGC 3077, and NGC 2976 being the four central galaxies of the M 81 complex. Uniting those galaxies that have one of these four central galaxies as their MD yields 31 galaxies attributed to the M 81 complex. Only one galaxy, KDG 052, is attributed to Holm II as MD and two galaxies form a system around NGC 2403, DDO 44, and NGC 2366, which have NGC 2403 as their MD. Out of the 31 galaxies in the M 81 complex, five galaxies, all of which have M 81 as their MD, have Θ1 < 01. Apart from these, there are 14 additional galaxies with other MDs beyond a distance of 1.5 Mpc from M 81 that also have Θ1 < 0. For each galaxy in our dataset, the B-band magnitude was measured as well. We summarise all information available for the 72 galaxies in Table A.1 in an appendix. To visualise the dataset, we chose supergalactic co-ordinates (see Fig. 2).
2.2. Comparison to our previous dataset
All 21 galaxies of our previous dataset discussed in Wagner & Benisty (2025), originally assembled by Müller et al. (2024), are contained in the new dataset, d1012+64 being called UGC05497. Table A.1 indicates the membership of a galaxy in the Müller et al. (2024) dataset with a star-superscript behind the name of the galaxy. Hence, the 21 galaxies are all at distances of much less than 1 Mpc from M 81.
For KDG 063 and HS 117, no velocities were given in the new dataset. KDG 063 is missing a far-UV flux, so that the previous velocity measurement may be a spurious detection of local Galactic emission. HS 117 shows a far-UV flux, yet only a faint one, requiring a follow-up observation.
The eight satellites in the Müller et al. (2024) dataset beyond the second-turnaround radius of 230 kpc all have Θ1 values larger or equal than 1.0. So we consider them to be bound to the M 81 complex for now.
3. Embedding in the local environment
To understand the structure of the Hubble flow around the M 81 complex, we analysed its embedding in the local environment. We collected 103 galaxies with TRGB- and SBF-based distances with a distance of less than 8 Mpc from us and 5.12 Mpc around M 81, a supergalactic latitude smaller than 10°, and a supergalactic longitude between 0° and 80° for this task. This sample, restricted to SGL < 65°, is highly complete down to log(LK) = 7.0. The larger surroundings also point at the mini void behind the M 81 complex as seen from us. Table A.2 lists all of the galaxies used in this section.
In Müller et al. (2024), the flattened structure of the satellite galaxies within a radius of about 250 kpc around the barycentre is studied using the galaxies marked with a star in Table A.1. Additional galaxies (not listed in Table A.1 because they still lack velocity measurements) are also used to constrain the spatial structure of the M 81 complex in Müller et al. (2024). The direction of the smallest extent of the M 81 complex in supergalactic co-ordinates was found to be n = (−0.1314,+0.0374,+0.9906). Excluding four potential outliers, one of which is HS 117, the resulting vector aligns even more with the SGZ axis.
In comparison, we performed a singular value decomposition (SVD) to determine the axes of largest and smallest extent of the larger volume covered by our dataset. To investigate the robustness of the result, we anchored the SVD first around the mean location, then around the median location of all galaxies in Table A.2, and lastly around the centre of mass of the six galaxies with the highest LK: IC 342, NGC 2403, M 81, NGC 2787, NGC 4258, and NGC 4736. We obtained the direction of smallest extent for the mean of all galaxies as nmean = (0.0498,−0.1439,0.9883) Mpc, for the median as nmedian = (0.0500,−0.1441,0.9883) Mpc, and for the centre of mass of the six most luminous galaxies as ncom = (0.0368,−0.1567,0.9870) Mpc. Thus, the alignment of these directions with respect to the SGZ axis is recovered in the larger volume as well.
Moreover, we also analysed the dependence on the volume covered by the galaxies and the selection of galaxies by restricting the dataset to the 89 galaxies within 3 Mpc from M 81 and to the 34 galaxies within 0.25 Mpc around M 81, which is approximately the volume covered by Müller et al. (2024), yet sampled with slightly different galaxies. While the former yields a good alignment with the previous three directions of smallest extent, n< 3Mpc = (−0.0392,−0.1887,0.9812) Mpc, the inner core is not well aligned anymore with its n< 0.25Mpc = (−0.4602,0.2073,0.8633) Mpc.
Fig. 3 shows the resulting planes of maximum extent for the entire data volume, the galaxies in a 3 Mpc radius around M 81, and the galaxies in a 0.25 Mpc radius around M 81. As can be read off the plot, and more clearly from the rotating plot in the online movie, the planes become more aligned with increasing volume size. The selection of galaxies by Müller et al. (2024) is already sufficient to arrive at the larger-scale alignment roughly oriented parallel the SGX-SGY plane, in good agreement with many other works detecting sheet-like structures in the local Universe in similar directions; for instance McCall (2014), Anand et al. (2019), or Peebles (2023).
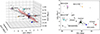 |
Fig. 3. (Movie online, left plot) Filamentary structure of the local M 81 group including all galaxies of Table A.2. Determining the directions of smallest extent for all 103 galaxies anchored at their mean location, the normal vector to the grey plane was obtained. An analogous calculation for the volume in a 3 Mpc radius around M 81 yielded the red plane and its normal direction. For the volume in the 0.25 Mpc radius around M 81, the blue plane and its normal direction were obtained. The former two planes become more aligned to the SGX-SGY-plane for increasing volume size. For further orientation, the most luminous galaxies in our dataset are marked in colour and their names are attached. The right plot shows a projection into the plane of SGL and the distance from us, and also shows the locations of the mean, median, and centre of mass of the six most luminous galaxies. |
Beyond that, we observe a filamentary structure around the M 81 complex on a smaller scale. This structure is not captured by a single plane, but rather by two filament arms: one from M 81 towards NGC 4258 and another to NGC 4736. The grey plane of maximum extent contains NGC 4258 (also known as M 106, with its water megamaser that has been used extensively to calibrate the cosmic distance ladder; see, for instance, Tully et al. (2023) for a recent discussion), yet it does not contain NGC 4736 (also known as Messier 94) and its satellites. Restricting the volume to a radius of 3 Mpc around M 81 and thereby excluding NGC 4258 and its satellites from the analysis, the red plane is lifted slightly towards NGC 4736 however still does not capture this filamentary part of M 81’s environment.
Connecting the local environment of the M 81 complex to the filaments found by Raj et al. (2024), the M 81 complex lies in their ‘filament 10’, which consists of 63 galaxies, with M 81 (called NGC 3031) marked as the major galaxy in the centre of this filament and Messier 101 (called NGC 5457) at the right end. The next galaxy close to M 81 is NGC 672, attributed to ‘filament 0’ at the crossing of various filaments. The larger filamentary structure in Raj et al. (2024) seems to share its direction with our grey plane, but occurs on a larger scale. Vice versa, the filamentary structures around the M 81 group captured in our work are on a slightly larger scale than the M 81 satellite alignments found by Müller et al. (2024). On the whole, irrespective of the scale we look at beyond a radius of 0.25 Mpc around M 81, the filaments seem to have a preferred alignment direction approximately perpendicular to the SGX-SGY plane.
4. Galaxy infall models
4.1. Velocity corrections
Before we apply the major and minor infall models, as set up in Karachentsev & Kashibadze (2006), to the velocities of the galaxies, possible corrections for relative mutual motions are in order. The impact of the observers’ own motion on the infall models is still an open question to be investigated in this work M 81 the measured velocities towards galaxies around M 81 contain a contribution of the solar motion with respect to the Milky Way centre and the Milky Way’s motion towards the Local Group centre. Assuming that both the M 81 complex and the Local Group move towards the Virgo cluster, correcting the measured velocities for the solar motion within the LG is sufficient to account for the relative motion between us and the M 81 complex.
Thus, we can either use the heliocentric velocities, vhel, or take into account the solar motion in the Local Group’s gravitational potential. The latter are called vLG in the following. We converted the measured vhel into vLG via
 (2)
(2)
in which b and l denote the latitude and longitude of the galaxy in the Galactic co-ordinate system (following the IAU’s 1958 definition). For consistency with the data base of Karachentsev et al. (2013), we also used the solar apex with respect to the Local Group rest frame,
 (3)
(3)
as determined in Karachentsev & Makarov (1996). Although this measurement goes back to the last century, it is still used as a reference for the NASA Extragalactic Database2 and has been re-measured over the years – for instance, in Tully et al. (2008) or Makarov et al. (2025) – showing a high degree of consistency. When converting vhel to vLG, the uncertainties in the solar apex need to be taken into account as well, resulting in larger error bars for the LG-based velocities, as is detailed in the following sections.
4.2. Barycentre of the M 81 complex
Since the M 81 complex is a group of galaxies, we need to determine its barycentre, rc, which serves as the centre for all infalling galaxies and the Hubble flow. In Wagner & Benisty (2025), we assumed M 81 to be the barycentre as a first ansatz and considered galaxies within a radial distance of 230 kpc, the extent of the second turnaround radius, to be gravitationally bound. Assuming uncertainties in the distance measures to be 5% for TRGB-based distances and 30% for all other methods, we find that this ansatz is still a good approximation of the true barycentre, because the next three central, brightest galaxies, M 82, NGC 3077, and NGC 2976, all have three-dimensional distances to M 81 that are compatible with zero within their observational uncertainties.
Nevertheless, we investigated a possible refinement of the barycentre position. In Karachentsev & Kashibadze (2006) two different methods were used to determine the barycentre: (1) applying the infall models to all galaxies with respect to a variable rc and determining rc as the location that minimises the velocity dispersion around a Hubble flow fit (see Sect. 5.2); (2) assuming that the mass of the galaxies is proportional to their K-band luminosity, LK, with the same mass-to-light ratio, Υ ≡ mj/LKj, for all galaxies, j. This was motivated in Makarov & Karachentsev (2011) and Tully (2015b) by the fact that the observed infrared flux in the local cosmic volume is hardly influenced by dust or young stellar contents, so the same mass-to-light ratio can be used to estimate the stellar mass for all galaxies irrespective of their type and morphology. Assuming that the dark-matter content scales in the same manner, the three-dimensional centre of mass was calculated from the observed angles on the sky and distance,
 (4)
(4)
in which ng denotes the number of all galaxies gravitationally bound to the M 81 complex. Since Υ cancels out, we do not require a specific value for the mass-to-light ratio to be known, only the weaker assumption that Υ is the same for all galaxies involved. As is noted in Wagner & Benisty (2025), this formula requires the group’s mass to be contained in the galaxies without additional, group-scale dark-matter halos.
Similar to the LG, Karachentsev & Kashibadze (2006) simplified Eq. (4) to only include the two brightest galaxies in the group, M 81 and M 82, such that rc is located on their connection line. We repeated their calculation with the updated observations and also extended the study to the barycentre determined from the four brightest central galaxies in the M 81 complex. We retrieved their K-band luminosities from Karachentsev et al. (2013) as log(LK(M 81)) = 10.95, log(LK(M 82)) = 10.59, log(LK(N 3077)) = 9.57, and log(LK(N 2976)) = 9.44. As the central galaxies of the M 81 complex fulfil the small angle approximation, we calculated the line-of-sight velocity component of the barycentre by replacing r by vhel in Eq. (4). Table 1 summarises all results.
Barycentre determination of the M 81 complex assuming M 81.
The uncertainties in rc, the absolute value of the barycentre distance to us, and vLGc, the absolute value of the line-of-sight velocity component corrected for our motion within the LG, were obtained by a linear propagation of uncertainty, taking into account the uncertainties in the line-of-sight distances, line-of-sight velocities, and the uncertainties in the apex parameters when correcting for our motion in the LG. The detailed equations for the propagation of all uncertainties are given in Appendix B.
Lastly, we investigated a varying dark-matter content for the spiral M 81, de Vaucouleurs morphological type 1 or 2, and the spiral but edge-on starburst M 82, de Vaucouleurs morphological type 5, 6, or 7, according to Karachentsev & Kashibadze (2021). Then, Υ(M 81) = (73 ± 15) M⊙/L⊙ and Υ(M 82) = (17.4 ± 2.8) M⊙/L⊙. Calculating the barycentre properties including the varying Υ is summarised in the last row of Table 1. Only the amplitudes and directions of the velocity vectors in the heliocentric and the Local-Group frame change significantly, while the position of the centre still coincides with the one of M 81 within uncertainty bounds.
We thus conclude that the position of the centre of mass remains robustly located at the position of M 81 within the uncertainty bounds. Yet, the vhel of the barycentre changes beyond these limits, which becomes important for the infall models in Sect. 4.3. Only taking into account M 82 as the second-brightest central galaxy is sufficient to constrain the properties of the barycentre under the prerequisites stated above because the properties, including vhel, remain stable when including fainter central galaxies. Allowing for a varying mass-to-light ratio to account for different dark-matter contents of M 81 and M 82 according to heuristics found in Karachentsev & Kashibadze (2021), the velocity vectors tend to align more towards the ones of M 81. Yet, this barycentre does not minimise the velocity dispersion around the Hubble flow as the one with constant Υ does, as was shown in a systematic, dark-matter-model-independent analysis in Karachentsev & Kashibadze (2006). Moreover, determining the barycentre based on a minimisation of the velocity dispersion of the bound galaxies, similar to Karachentsev et al. (2009), we recovered the same barycentre within uncertainty bounds as the one listed in the second row of Table 1 and the one of Karachentsev & Kashibadze (2006). Due to this overall consistency, we thus chose the barycentre that was obtained in the second line of Table 1 in the following.
4.3. Infall models
After defining a centre with respect to which the infall models were calculated and setting up the velocity corrections due to potential biases, we now introduce the infall models that have already been detailed in (Karachentsev & Kashibadze 2006) and Wagner & Benisty (2025). In the following, all infall models approximate the radial velocity component between the centre of mass of the M 81 complex and the surrounding satellite galaxies. To simplify the notation compared to Wagner & Benisty (2025), we denote the absolute values of the line-of-sight distance and velocity components as r and v, respectively. Subscripts c and j denote the group’s barycentre and a galaxy j, respectively, such that rcj denotes the absolute value of the three-dimensional distance between the barycentre and galaxy j. The angular distance on the sky between the barycentre and a galaxy, j, is denoted by θcj. Fig. 4 summarises the notation and directions of vectors.
The minor infall model approximates the amplitude3 of the radial infall velocity of galaxy j onto the barycentre as
 (5)
(5)
This approximation treats the barycentre and galaxy j symmetrically and is an accurate representation of the radial infall velocity if the velocity components perpendicular to the line of sight are negligible.
The major infall model is an asymmetric approximation to the radial infall velocity of galaxy j onto the barycentre:
 (6)
(6)
It can be derived by projecting the radial velocity onto the infalling galaxy’s line of sight. This model becomes an accurate representation of the radial infall velocity for a gravitational bound structure only moving with the cosmic expansion as a whole and containing only radially infalling galaxies. The table included in Fig. 4 lists the accuracy conditions once again.
The angular separation of the galaxies on the sky to the barycentre of the extended M 81 complex is about 44°, such that the small-angle approximation for both infall models by simply subtracting the line-of-sight velocity components of the barycentre and galaxy j is invalid. The latter is only applicable to the galaxies within the second turnaround radius that span a maximum angle of less than 2.3° on the sky, as is detailed in Wagner & Benisty (2025).
As is shown in Wagner & Benisty (2025) and Benisty & Mota (2025) by means of simulations, the minor infall statistically underestimates the radial velocity dispersion, while the major infall is an overestimate of the radial velocity dispersion for most of the groups tested. Applying both infall models to a cosmic structure, lower and upper bounds on the radial velocity dispersion are obtained.
Due to the lack of precise proper motions, only the line-of-sight velocity component was employed, such that the infall models are biased, as is detailed in Wagner & Benisty (2025). Moreover, while three-dimensional distance observations are possible nowadays, the celestial angles on the sky can be measured to a higher precision than the distance along the line of sight. Hence, the major sources of uncertainties in the resulting approximations of the radial infall velocity are the line-of-sight distances.
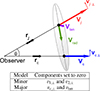 |
Fig. 4. Relative location and motion of a galaxy, j, at distance rj from an observer with respect to the centre of mass at distance rc. The vector vj represents the line-of-sight velocity of galaxy j, while vc is the line-of-sight velocity of the barycentre. The angle θ is measured between rj and rc. The prerequisites for the two infall models to accurately describe the radial velocity, vrad, are listed in the table. |
Fig. C.1 in the appendix shows all galaxy infall velocities for the minor (blue) and major infall models (red) and the simple difference of the line-of-sight velocities as the leading-order approximation to the radial velocity between each galaxy j and M 81, called vapp in Wagner & Benisty (2025) (black). The galaxies are sorted according to their three-dimensional distance to M 81. The closest is on the left; the farthest is on the right. The major infall model yields velocity amplitudes larger than 1000 km/s for 13 of the galaxies, which is why these values are not shown in the plot. While this figure was produced using the barycentre on the connection line between M 81 and M 82 and taking into account the observers’ motion within the Local Group, we systematically investigate the impact of each of these assumptions on the infall models and on the Hubble flow fit in the next section.
5. Hubble flow fit
5.1. Fitting function and uncertainty propagation
With the infall velocities set up in Sect. 4 and the independently determined distances for all galaxies to the barycentre of the M 81 complex, denoted as ‖rcj‖2 ≡ rcj for each galaxy j, we plot the Hubble diagram for the M 81 group. For the Hubble flow fit to the Hubble diagram, we used the approximation from Peirani & de Freitas Pacheco (2006. 2008), Peñarrubia et al. (2014), Benisty & Del Popolo (2025):
 (7)
(7)
in which κ is a scaling factor in front of the Hubble constant H0, G is the gravitational constant, and M is the total mass of the M 81 complex. In Peñarrubia et al. (2014), κ ≈ 1.4, but varying values can be found in the literature, depending on the embedding background (Del Popolo et al. 2021; Del Popolo & Chan 2022). The fit thus yields H0 and M from the infall velocities and the observed distances of all galaxies in the M 81 complex. The turnaround, |vinfj| = 0, from Eq. (7) yields the known enclosed mass relation from Sandage (1986):
 (8)
(8)
where rta is the turnaround distance of the structure.
Before we determined the best-fit H0 and M, we investigated the impact of shifting the barycentre from M 81 to the point on the connection line between M 81 and M 82 determined in Sect. 4.2, as well as the impact that the corrections to the velocities for our motion in the Local Group detailed in Sect. 4.1 have. Since the Hubble flow also starts at a specified minimum distance from the barycentre, dmin, and extends to a maximum distance from the barycentre, dmax, the impact of these fitting parameters also needs to be investigated. For all analyses, we only employed the 58 galaxies that have the TRGB-based distances with the highest measurement precision out of all of the distance-measure methods.
In order to obtain the most realistic estimates of uncertainties, for each galaxy j that has a TRGB-based distance we drew 10 000 samples from a Gaussian distribution around the observed rj and vhelj, respectively, using Δrj = 0.05 rj and Δvhelj as widths. Subsequently, for each of the 10 000 sample datasets containing 58 galaxies, we determined the barycentre (either the position of M 81 in this sample dataset, or the point on the connection line between the M 81 and M 82 sample detailed in Sect. 4.2). We then calculated the infall velocities of all 58 galaxies towards this barycentre for each of the 10 000 datasets. In this way, the standard deviation of the 10 000 samples around the mean distance of galaxy j to the barycentre serves as the confidence bound on the TRGB-based distances. For the minor infall velocity, we analogously set up its confidence bound based on the standard deviation around the mean minor infall velocity for each galaxy. For the major infall velocity, we needed to set up its confidence bound based on the 0.159 and 0.841 quantiles, which corresponds to the 1σ bounds around the mean. This is the case due to chance alignments between galaxies and the barycentre that cause the denominator in Eq. (6) to diverge.
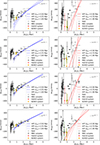 |
Fig. 5. Dependence of the Hubble flow fit on the minimum distance from the barycentre for the minor (left column) and major infall models (right column). The first and third rows have M 81 as the centre of mass. The second and fourth row use the barycentre located on the connection line between M 81 and M 82. The first and second row use vhel. The third and fourth row use vLG. For the major infall model, velocities up to a maximum value of 700 km/s were included in the fit. |
5.2. Impact of parameter dependencies and assumptions
We systematically show the impact of the velocity corrections, the choice of the barycentre, and data cuts on the Hubble flow fit. The Hubble diagrams in Fig. 5 were generated for the four combinations, from top to bottom: (1) M 81 as the barycentre and vhel as the basis to calculate the infall velocities, (2) the point on the connection line between M 81 and M 82 as the barycentre and vhel for the calculation of the infall velocities, (3) M 81 as the barycentre and vLG to determine the infall velocities, and (4) the point on the connection line between M 81 and M 82 as the barycentre and vLG to calculate the infall velocities. For each of these four options, the minor or major infall model was used to calculate the infall velocities, as is shown on the left side of Fig. 5 in blue and on the right side in red, respectively. The uncertainties in the three-dimensional distance between all galaxies and the barycentre, ‖rcj‖2, and in the infall velocities, |vinfj|, were obtained in the manner detailed in Sect. 5.1, based on 10 000 samples. Increasing the amount of samples to 100 000 does not change the size of the error bars significantly.
In addition, we also investigated variations in the minimum distance from the barycentre, dmin, to start the Hubble flow fit. Karachentsev & Kashibadze (2006) chose 0.5 Mpc as fiducial value. We additionally show Hubble flow fits starting at 0.75 Mpc and 1 Mpc distance to the barycentre. Due to the instability of the major infall model, we also tested the impact of upper bounds on the major infall velocity, using an upper absolute value of 700 km/s and 500 km/s.
All Hubble flow fits to the data given the uncertainties calculated by the sampling were obtained by total least squares using a SVD. This is possible because H0 and M are both larger than zero and Eq. (7) is a linear function in H0 and  as parameters. The lines (solid, dashed, dotted) in Fig. 5 show the resulting Hubble flow fits for the varying dmin. The corresponding best-fit values for κH0 and M are listed in Table C.1 in the appendix. From the figure, it is already clear that the minor infall model yields very robust Hubble flow fits, irrespective of dmin. We also note that the variance around the Hubble flow is decreased when using the refined barycentre position and velocity between M 81 and M 82 and additionally applying velocity corrections for our motion in the Local Group. The same trends can also be read off the plots for the major infall model; however, with much less robust results due to a diverging denominator in Eq. (6) when galaxies are sub-optimally aligned with the barycentre such that the denominator becomes small. Table C.1 even lists unphysical, negative values for κH0 and unrealistically large masses, M. To further investigate the robustness of the major infall model, we studied the impact of different cuts on ‖|vinfj‖2, as is shown in the central and bottom tables of Table C.1. Since both velocity cuts, 700 km/s and 500 km/s, lead to overestimated H0 and M values, the larger spread of the major infall velocities compared to the minor infall velocities causes the less stable Hubble flow fit. From these results, we also conclude that the major infall model, except for the unphysical negative H0-values, can be considered as an upper bound on κH0 and M. Establishing the minor infall model as a lower bound for both parameters is motivated from Benisty & Mota (2025): The Illustris TNG50 simulation analysed in their Fig. 3 shows that the starting velocity for the Hubble flow fit is above the true one and the slope for the minor infall model is smaller than the one of the simulated velocities. This result found in mock data seems to be valid for observations based on the results shown in Fig. 6.
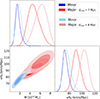 |
Fig. 6. Confidence intervals on κH0 and M for the Hubble flow fit using the minor (blue) and major infall models (red) with respect to the barycentre between M 81 and M 82, a starting distance for the fit of dmin = 0.5 Mpc and the two maximum distances of galaxies included in the fit of dmax = 4 Mpc (omitting the two farthest galaxies) and dmax = 7 Mpc (including all galaxies in the dataset). To obtain a robust fit, galaxies with ‖vmajj‖2 > 500 km/s were excluded. The overlap model yields the best-fit parameter values from the 2σ regions where the minor and major infall models coincide. |
Given that at least 20 galaxies are available to perform the Hubble flow fits, the resulting parameters are expected to differ only slightly from those obtained with ordinary least squares. As ordinary least squares only allows for shifts in the velocity direction, it yields increased stability compared to the de-regularizing total least squares, which allows for shifts in both distance and velocity directions. Therefore, our best-fit Hubble flow parameters are determined by ordinary least squares in the next section.
5.3. Best-fit Hubble flow fit
Our final Hubble flow fit was performed using the barycentre between M 81 and M 82 and accounting for velocity corrections in the Local Group. In addition, we enforced ‖vinfj‖2 ∈ [−500,500] km/s. The uncertainties on the distances to the barycentre and infall velocities were again determined in the manner detailed in Sect. 5.1. Galaxies with uncertainties larger than 10% on the infall velocity and 100% on the distance to the barycentre were omitted.
To test the impact of the embedding environment, we performed two fits for each infall model: one including the last two galaxies around 5 Mpc distance from M 81, choosing dmax = 7 Mpc, and one excluding those galaxies, dmax = 4 Mpc. Within these boundaries, there are five satellite galaxies that have θ1 < 0 for M 81 as their major disturber (large black points in Fig. 5).
We fitted Eq. (7), the model-based infall velocity, |vinfj(mod)|, to the infall velocity inferred from the measurements, |vinfj(obs)|, via a χ2-optimisation with
 (9)
(9)
in which σj is given by adding the squared uncertainties in the infall model velocity and the linear propagation of uncertainty of the distance uncertainty:
 (10)
(10)
To constrain the best-fit values for κH0 and M, a nested sampling was used with the PolyChord package (Handley et al. 2015). We used a uniform prior for κH0 ∈ [10,200] km/s/Mpc and M ∈ [0.01,8] × 1012 M⊙. Fig. 6 is plotted with the getdist package (Lewis 2025) and shows the resulting confidence regions for the minor (blue) and the major infall models (red), once for dmax = 4 Mpc (pale regions) and once for dmax = 7 Mpc (intensely coloured regions). The table underneath the corner plot lists the best-fit values for κH0 and M and their 1σ confidence intervals, as well as an estimate for H0 when fixing κ = 1.4. Moreover, we report the best-fit values for M and H0 in which minor and major infall models coincide within their 2σ confidence bounds, denoted as the ‘overlap’ model.
The values for the posterior distributions.
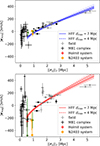 |
Fig. 7. Hubble flow fits (Eq. (7)) for the minor (top) and major infall models (bottom) with a starting distance for the fit of dmin = 0.5 Mpc and a maximum distance of galaxies included in the fit of dmax = 7 Mpc (solid lines) and dmax = 4 Mpc (dashed lines). The 1σ confidence bounds around both fits are based on linear propagation of uncertainties for the standard deviations of κH0 and M as given in the table below Fig. 6. |
From the table, we read off that excluding the outmost two galaxies from the fit, the best-fit M and κH0 are increased compared to the fit including these galaxies. Given that these two galaxies, DDO 87 and UGC05423, both have Θ1 < 0 for their major disturbers, it is likely that these galaxies belong to the Hubble flow of the M 81 complex. While one could choose a different κ to account for the varying dmax when determining H0, we shall see in Sect. 7 that the increased mass, particularly for the major infall model, becomes inconsistent with other mass estimation approaches, hinting at the necessity to include these galaxies in the Hubble flow fit.
For the quality of fit, Fig. 7 shows the Hubble-flow fits (Eq. (7)) for the minor (top panel) and major (bottom panel) infall models for the 58 galaxies with TRGB-based distances in our dataset. The fits are shown for two different maximum distances: dmax = 7 Mpc (solid lines) and dmax = 4 Mpc (dashed lines). The shaded regions around the fits indicate 1σ credible intervals, obtained via linear propagation of uncertainties for the standard deviations of κH0 and M listed in Table 6.
6. Dynamical mass estimates
In order to investigate the consistency of the Hubble flow fit and the mass inferred from it, we compare our results obtained in Sect. 5 with masses inferred from the virial theorem and the projected-mass-method.
6.1. Hubble-flow-fit mass
As is listed in the table below Fig. 6, the minor infall model yielded a low mass and Hubble constant, while the major infall model obtained systematically higher values for M and H0. However, the inferred parameter values overlap within their 2σ confidence bounds. From the overlapping confidence regions, we infer a common mass of M = (2.28±0.49) × 1012 M⊙, and H0 = (62.6±5.4) km/s/Mpc. Our best-fit H0-values are thus in agreement with Planck Collaboration VI (2020) within 1σ, yet they are also in agreement with Riess et al. (2022) within 2σ.
6.2. Projected mass
As a second mass estimate, we determined the projected mass, Mproj, following the formalism of Bahcall & Tremaine (1981), An & Evans (2011):
 (11)
(11)
in which each galaxy’s line-of-sight velocity is given as vj and Rcj ≡ rcθcj is the physical, projected two-dimensional distance between galaxy j and the barycentre. As usual, G is the gravitational constant and αproj is a geometric factor that encapsulates projection and anisotropy effects. For an isotropic velocity distribution, we adopted αproj = 16/π. Inserting the vLG as velocities for all ng = 58 galaxies that have TRGB-based distances and the position of the barycentre between M 81 and M 82 as rc, the mass of the M 81 complex becomes Mproj = (2.74 ± 0.36)×1012 M⊙. Its uncertainty was inferred from a linear propagation of uncertainties from the measurement uncertainties (see Table A.1).
6.3. Virial mass
This estimator assumes that nvir satellite galaxies act as test particles in virial equilibrium in a common potential, such that Mvir reflects the total gravitationally bound mass within the region sampled by the tracers:
 (12)
(12)
in which σv denotes the velocity dispersion of the nvir galaxies and r0j is the three-dimensional distance between the centre of the virial volume and galaxy j (Bahcall & Tremaine 1981; Heisler et al. 1985; An & Evans 2011; Tully 2015a). As usual, G is the gravitational constant. The dimensionless coefficient, αvir, represents a geometric form factor accounting for an underlying dark-matter distribution and velocity anisotropies. For instance, αvir = 3 corresponds to isotropic orbits in an isothermal sphere, αvir = 2.6 to isotropic velocities in a Navarro-Frenk-White profile, and αvir = 2.4 to specific anisotropy models (Limber & Mathews 1960; Bahcall & Tremaine 1981).
Modelling the M 81 complex with a single, spherically symmetric potential is a good approximation only for radii much larger than the virial radius. Since the core is better approximated as a binary system with M 81 and M 82 as the most massive galaxies (see also Sect. 4.2), we generalised the virial mass estimate to a binary system according to Diaz et al. (2014) and Benisty et al. (2024). To do so, we replaced r0j in Eq. (12) with the mass-weighted average
 (13)
(13)
in which each satellite galaxy, j, has a distance of rM 81j to the centre of M 81 and rM 82j to M 82. The mass ratio is mM 81 ≡ MM 81/(MM 81 + MM 82) with the masses of M 81 and M 82 being MM 81 and MM 82, based on their luminosity as in Sect. 4.2. Then, the velocity dispersion, σv, was determined with respect to the barycentre between M 81 and M 82 from Sect. 4.2. To encompass uncertainties in the dark matter distribution, we adopted a broad uniform prior of αvir ∈ [2, 4]. For the nvir = 36 member galaxies bound to the M 81 complex, we estimated σv = (106 ± 4) km/s from the stable minor infall model velocities multiplied by  , which is in good agreement with the previous best-fit value of σv = 102 km/s obtained in Wagner & Benisty (2025). Moreover, rG = (0.41 ± 0.04) Mpc, which is close to dmin = 0.5 Mpc as the starting radius for the Hubble flow fit, from the data in Table A.1 to arrive at Mvir = (3.11 ± 0.69)×1012 M⊙.
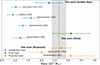 |
Fig. 8. Comparison of M 81-group mass estimates of this work using the Hubble flow, virial, and projected mass methods (blue circles, green squares, and orange diamonds, respectively), together with mass estimates from the literature. The vertical dashed grey line and shaded band indicate the weighted mean and 1σ uncertainty of the three estimates of this work. For comparison, literature values are shown: Hubble flow analyses by Del Popolo et al. (2021), Del Popolo & Chan (2022), Peirani & de Freitas Pacheco (2008), and Karachentsev et al. (2002), Karachentsev & Kashibadze (2006); virial and projected pass estimates from Karachentsev et al. (2002); and the most recent projected mass by Karachentsev & Kashibadze (2021). |
7. Conclusion
We employed precise TRGB-based distances for nine previously unmeasured or imprecisely measured galaxies to determine the dynamics of M 81 complex. This expanded dataset, now comprising of 58 galaxies with high-precision TRGB-based distances, has allowed us to perform a robust dynamical analysis of the group’s core and its embedding in the local Hubble flow.
Despite the increased amount of data and the improved precision of it, finding an alignment of the M 81 complex with the supergalactic SGX-SGY-plane still depends on a few galaxies between the second turnaround radius of ca. 0.23 Mpc and the virial radius of ca. 0.41 Mpc. The alignment, however, becomes robust beyond the virial radius, which formed the outer limit of the study by Müller et al. (2024). Our study in Sect. 3 revealed the filamentary structure around the M 81 group in a volume of about 5 Mpc radius. Hence, the filaments found are on a scale larger than the satellite plane of Müller et al. (2024) and on a smaller scale than the filaments of Raj et al. (2024).
Within this environment, our dataset contains a Hubble flow of more than 30 galaxies for which we performed a Hubble flow fit. Under the assumption that light traces mass, we demonstrate that this Hubble flow fit is best performed from the barycentre of the group determined as the point on the connection line between the two most luminous galaxies in the group, M 81 and M 82. Incorporating more galaxies, such as NGC 3077 and N 2976, does not change the position or line-of-sight velocity of the barycentre further for the given measurement precision. Moreover, it is important to account for the observers’ motion in the Local Group to alleviate the variance in the infall velocities of the satellite galaxies onto the barycentre of the M 81 complex.
We also investigated the impact of the satellite selection for the Hubble flow fit. Both models systematically increase their best-fit M and H0 values when restricting the fitting region to a maximum distance of 4 Mpc from the barycentre. Identifying the most distant galaxies on the Hubble flow is thus not only important to obtain an accurate value for H0, but also for M. Varying the starting distance for the Hubble flow fit, we find that the minor infall model yields more robust mass and H0 values for different starting and ending points of the fit than the major infall model, which is highly sensitive to these choices. In general, analogously to Wagner & Benisty (2025), we find that the major infall model shows a larger dispersion in the infall velocities and that the minor and major infall models can be considered as lower and upper bounds for the true Hubble flow fit parameters. We therefore determined the Hubble flow fit parameters, MHFF = (2.28 ± 0.49)×1012 M⊙ and H0 = (62.6 ± 5.4) km/s/Mpc, from the overlapping 2σ bounds on both infall models. For the latter, we set κ = 1.4 similarly to Peñarrubia et al. (2014), fixing the degeneracy between the background embedding and H0 in the Hubble flow formula. Choosing smaller κ, H0 can be larger, shifting the agreement from Planck Collaboration VI (2020) to Riess et al. (2022). Our H0 value with an imprecision of about 8% is not precise enough to alleviate the Hubble tension, but it is consistent with prior works inferring H0 in the local Universe, using TRGB-based distances (see, for instance, Kim et al. (2020) for a similar result of a Hubble flow fit in the Virgo cluster and Adame et al. (2025) and references therein for a more details on other H0-probes). Tully et al. (2023) also discuss the TRGB-zero-point calibrations and current disputes over it, potentially causing the discrepancy in Cepheid-based distances in the local volume.
Comparing the Hubble flow fit M of the entire M 81 complex with the virial and projected mass estimates based on our improved dataset, a more consistent picture emerges compared to prior work from the literature, as is summarised in Fig. 8. Analyses by Del Popolo et al. (2021), Del Popolo & Chan (2022), and Peirani & de Freitas Pacheco (2008) obtained masses from a Hubble flow fit close to 1012 M⊙, while slightly higher values were reported by Karachentsev et al. (2002) and Karachentsev & Kashibadze (2006). Using alternative approaches, such as the virial theorem and projected mass estimators, Karachentsev et al. (2002) and Karachentsev & Kashibadze (2021) obtained comparable or higher masses. Overall, the literature suggested that the M 81 system has a total mass of the order of (1 − 2)×1012 M⊙, consistent with expectations for a relatively low-mass, nearby galaxy group dominated by a few large spirals. Yet, previous mass estimates were based on even sparser datasets and only used the minor infall model, which jointly led to systematically lower mass estimates, with masses around 1012 M⊙, than the values obtained in this work, Mproj = (2.74 ± 0.36)×1012 M⊙ and Mvir = (3.11 ± 0.69)×1012 M⊙. The latter, however, is subject to a very large uncertainty based on the known logarithmic divergence of the harmonic radius, rG (Bahcall & Tremaine 1981).
The consistency among the three mass estimation techniques in our analysis suggests that the higher mass is not an artefact of a single estimator, but rather reflects a genuine physical difference that may arise from updated kinematics, improved distance measurements, and a more accurate treatment of the system’s gravitational potential. The higher inferred masses imply that M 81 may be dynamically more evolved and more strongly bound than earlier studies indicated, with potential implications for its satellite population and the distribution of dark matter within the group. The already planned HST observations in the SNAP 18070 programme of eight galaxies with poorly constrained distances, UGC06451, KKH30, SMDG0956+82, KDG162, Dw1907+63, Dw1940+64, Dw1559+46, and Dw1735+57, in the upcoming C 33 cycle will certainly bring further clarity and enable our results to be checked in the near future.
8. Data availability
Movie associated to Fig 3 is available at https://www.aanda.org
Acknowledgments
DB is supported by the Minerva Stiftung Gesellschaft für die Forschung mbH. This article is based on work from the COST Action CA21136 – “Addressing observational tensions in cosmology with systematics and fundamental physics” (CosmoVerse) and the Cost Action CA23130 – “Bridging high and low energies in search of quantum gravity” (BridgeQG), supported by COST (European Cooperation in Science and Technology). IK is supported by the Russian Science Foundation grant No 24-12-00277, “Cosmography of the Local Volume of the Universe within 15 megaparsecs”.
References
- Adame, A. G., Aguilar, J., Ahlen, S., et al. 2025, JCAP, 2025, 021 [CrossRef] [Google Scholar]
- An, J. H., & Evans, N. W. 2011, MNRAS, 413, 1744 [Google Scholar]
- Anand, G. S., Tully, R. B., Rizzi, L., Shaya, E. J., & Karachentsev, I. D. 2019, ApJ, 880, 52 [Google Scholar]
- Bahcall, J. N., & Tremaine, S. 1981, ApJ, 244, 805 [Google Scholar]
- Benisty, D., & Del Popolo, A. 2025, ArXiv e-prints [arXiv:2510.11382] [Google Scholar]
- Benisty, D., & Mota, D. 2025, A&A, 698, A43 [NASA ADS] [CrossRef] [EDP Sciences] [Google Scholar]
- Benisty, D., Chaichian, M. M., & Tureanu, A. 2024, Phys. Lett. B, 858, 139033 [Google Scholar]
- Del Popolo, A., & Chan, M. H. 2022, ApJ, 926, 156 [NASA ADS] [CrossRef] [Google Scholar]
- Del Popolo, A., Deliyergiyev, M., & Chan, M. H. 2021, Phys. Dark Universe, 31, 100780 [Google Scholar]
- Diaz, J. D., Koposov, S. E., Irwin, M., Belokurov, V., & Evans, N. W. 2014, MNRAS, 443, 1688 [CrossRef] [Google Scholar]
- Handley, W. J., Hobson, M. P., & Lasenby, A. N. 2015, MNRAS, 450, L61 [NASA ADS] [CrossRef] [Google Scholar]
- Heisler, J., Tremaine, S., & Bahcall, J. N. 1985, ApJ, 298, 8 [CrossRef] [Google Scholar]
- Karachentsev, I. D., & Kashibadze, O. G. 2006, Astrophysics, 49, 3 [NASA ADS] [CrossRef] [Google Scholar]
- Karachentsev, I., & Kashibadze, O. 2021, Astron. Nachr., 342, 999 [NASA ADS] [CrossRef] [Google Scholar]
- Karachentsev, I. D., & Makarov, D. A. 1996, AJ, 111, 794 [NASA ADS] [CrossRef] [Google Scholar]
- Karachentsev, I. D., & Makarov, D. I. 1999, IAU Symp., 186, 109 [Google Scholar]
- Karachentsev, I. D., Dolphin, A. E., Geisler, D., et al. 2002, A&A, 383, 125 [CrossRef] [EDP Sciences] [Google Scholar]
- Karachentsev, I. D., Kashibadze, O. G., Makarov, D. I., & Tully, R. B. 2009, MNRAS, 393, 1265 [NASA ADS] [CrossRef] [Google Scholar]
- Karachentsev, I. D., Makarov, D. I., & Kaisina, E. I. 2013, AJ, 145, 101 [Google Scholar]
- Kim, Y. J., Kang, J., Lee, M. G., & Jang, I. S. 2020, ApJ, 905, 104 [NASA ADS] [CrossRef] [Google Scholar]
- Kourkchi, E., Courtois, H. M., Graziani, R., et al. 2020, AJ, 159, 67 [NASA ADS] [CrossRef] [Google Scholar]
- Lewis, A. 2025, JCAP, 08, 025 [Google Scholar]
- Limber, D. N., & Mathews, W. G. 1960, ApJ, 132, 286 [NASA ADS] [CrossRef] [Google Scholar]
- Makarov, D., & Karachentsev, I. 2011, MNRAS, 412, 2498 [NASA ADS] [CrossRef] [Google Scholar]
- Makarov, D., Makarov, D., Makarova, L., & Libeskind, N. 2025, A&A, 698, A178 [NASA ADS] [CrossRef] [EDP Sciences] [Google Scholar]
- McCall, M. L. 2014, MNRAS, 440, 405 [NASA ADS] [CrossRef] [Google Scholar]
- Müller, O., Heesters, N., Pawlowski, M. S., et al. 2024, A&A, 683, A250 [NASA ADS] [CrossRef] [EDP Sciences] [Google Scholar]
- Peebles, P. J. E. 2023, MNRAS, 526, 4490 [NASA ADS] [CrossRef] [Google Scholar]
- Peirani, S., & de Freitas Pacheco, J. A. 2006, New Astron., 11, 325 [NASA ADS] [CrossRef] [Google Scholar]
- Peirani, S., & de Freitas Pacheco, J. A. 2008, A&A, 488, 845 [NASA ADS] [CrossRef] [EDP Sciences] [Google Scholar]
- Peñarrubia, J., Ma, Y.-Z., Walker, M. G., & McConnachie, A. 2014, MNRAS, 443, 2204 [Google Scholar]
- Planck Collaboration VI. 2020, A&A, 641, A6 [NASA ADS] [CrossRef] [EDP Sciences] [Google Scholar]
- Raj, M. A., Awad, P., Peletier, R. F., et al. 2024, A&A, 690, A92 [NASA ADS] [CrossRef] [EDP Sciences] [Google Scholar]
- Riess, A. G., Yuan, W., Macri, L. M., et al. 2022, ApJ, 934, L7 [NASA ADS] [CrossRef] [Google Scholar]
- Sandage, A. 1986, ApJ, 307, 1 [NASA ADS] [CrossRef] [Google Scholar]
- Shaya, E. J., Tully, R. B., Hoffman, Y., & Pomarède, D. 2017, ApJ, 850, 207 [NASA ADS] [CrossRef] [Google Scholar]
- Tully, R. B. 2015a, AJ, 149, 54 [NASA ADS] [CrossRef] [Google Scholar]
- Tully, R. B. 2015b, AJ, 149, 171 [NASA ADS] [CrossRef] [Google Scholar]
- Tully, R. B., Shaya, E. J., Karachentsev, I. D., et al. 2008, ApJ, 676, 184 [Google Scholar]
- Tully, R. B., Kourkchi, E., Courtois, H. M., et al. 2023, ApJ, 944, 94 [NASA ADS] [CrossRef] [Google Scholar]
- Wagner, J., & Benisty, D. 2025, A&A, 698, A211 [NASA ADS] [CrossRef] [EDP Sciences] [Google Scholar]
There are six additional galaxies with other distance measures which have Θ1 < 0, so it may be worth obtaining TRGB-based distances for those.
Our notation is the same as in Wagner & Benisty (2025), with |⋅| denoting the signed amplitude of the radial velocity vector with a fixed direction towards the barycentre, a positive sign in this direction and a negative sign otherwise. The absolute value of a vector is defined as ‖ ⋅ ‖2.
Appendix A: Observational datasets
The data used in this paper.
Galaxy positions used to analyse the embedding of the M 81 group into the surroundings in Sect. 3.
Appendix B: Propagation of statistical uncertainties
Given the uncertainties in the measured distances and heliocentric velocities, the propagation of errors is performed as follows: We correct the heliocentric velocities for the solar motion in the Local Group according to Eq. (2),
 (B.1)
(B.1)
Due to the uncertainties in the apex parameters (Eq. 3), the linear uncertainty propagation
 (B.2)
(B.2)
with
 (B.3)
(B.3)
 (B.4)
(B.4)
 (B.5)
(B.5)
is just an approximation to realistic error bars, neglecting uncertainties in l and b as well.
Next, we equip distances to the barycentre with uncertainties. For the simplicity of notation, we define the measured distance to the barycentre and a galaxy j as rc ≡ ‖rc‖2 and rj ≡ ‖rj‖2, respectively. The angular distance between the barycentre and galaxy j is then θcj. In this notation, rcj ≡ ‖rc − rj‖2, and its uncertainty are given by
 (B.6)
(B.6)
Uncertainties in θcj are thus considered to be negligible again as in the previous step. Moreover, if the barycentre is determined as the mass-weighted positional average of several galaxies, the correlation between the uncertainties in rc and rj for those galaxies are neglected as well. Since these galaxies are located in the very centre of the M 81 complex and not relevant to constrain the second turnaround radius or the zero-velocity radius, a more precise error estimate is not important for this work.
Appendix C: Infall models and barycentre values
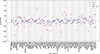 |
Fig. C.1. The infall velocities for all 72 galaxies in our dataset with respect to the barycentre of the M 81 complex located on the connection line between M 81 and M 82, including velocity corrections for the observers’ motion within the Local Group. The galaxies are sorted with increasing distance from M 81 from left to right. The minor infall model velocities are marked in blue, major infall velocities in red, and just taking the difference between the line-of-sight velocities of the barycentre and a galaxy j are marked in black. |
Hubble flow fit parameters for the minor (top row) and major infall model (centre, bottom row): κH0 in km/s/Mpc (left) and M in 1012 M⊙ (right) with the singular values as uncertainties.
All Tables
Galaxy positions used to analyse the embedding of the M 81 group into the surroundings in Sect. 3.
Hubble flow fit parameters for the minor (top row) and major infall model (centre, bottom row): κH0 in km/s/Mpc (left) and M in 1012 M⊙ (right) with the singular values as uncertainties.
All Figures
|
Fig. 1. Histogram of distances for all 71 galaxies with respect to M 81 as the centre (black bars) and only those 57 galaxies that have TRGB-based distances (red bars). The bin size is 0.25 Mpc. |
| In the text | |
|
Fig. 2. Locations of the 72 galaxies that have velocity measurements: physical positions in supergalactic co-ordinates in the SGX-SGY-plane (left), SGX-SGZ-plane (centre), and SGY-SGZ-plane (right). Galaxies in the environment are marked as ‘field’ (grey pluses), galaxies for which M 81, M 82, NGC 3077, or NGC 2976 is the major disturber are summarised under ‘M 81 complex’ (black dots), the galaxy attributed to Holm II as its major disturber and Holm II itself are called the ‘HolmII system’ (red xs), and NGC 2403 and two satellites galaxies are called the ‘N2403 system’ (yellow squares). M 81, Holm II, and NGC 2403 are additionally highlighted by green stars. Larger symbols indicate galaxies that have Θ1 < 0 and are thus unbound. |
| In the text | |
|
Fig. 3. (Movie online, left plot) Filamentary structure of the local M 81 group including all galaxies of Table A.2. Determining the directions of smallest extent for all 103 galaxies anchored at their mean location, the normal vector to the grey plane was obtained. An analogous calculation for the volume in a 3 Mpc radius around M 81 yielded the red plane and its normal direction. For the volume in the 0.25 Mpc radius around M 81, the blue plane and its normal direction were obtained. The former two planes become more aligned to the SGX-SGY-plane for increasing volume size. For further orientation, the most luminous galaxies in our dataset are marked in colour and their names are attached. The right plot shows a projection into the plane of SGL and the distance from us, and also shows the locations of the mean, median, and centre of mass of the six most luminous galaxies. |
| In the text | |
|
Fig. 4. Relative location and motion of a galaxy, j, at distance rj from an observer with respect to the centre of mass at distance rc. The vector vj represents the line-of-sight velocity of galaxy j, while vc is the line-of-sight velocity of the barycentre. The angle θ is measured between rj and rc. The prerequisites for the two infall models to accurately describe the radial velocity, vrad, are listed in the table. |
| In the text | |
|
Fig. 5. Dependence of the Hubble flow fit on the minimum distance from the barycentre for the minor (left column) and major infall models (right column). The first and third rows have M 81 as the centre of mass. The second and fourth row use the barycentre located on the connection line between M 81 and M 82. The first and second row use vhel. The third and fourth row use vLG. For the major infall model, velocities up to a maximum value of 700 km/s were included in the fit. |
| In the text | |
|
Fig. 6. Confidence intervals on κH0 and M for the Hubble flow fit using the minor (blue) and major infall models (red) with respect to the barycentre between M 81 and M 82, a starting distance for the fit of dmin = 0.5 Mpc and the two maximum distances of galaxies included in the fit of dmax = 4 Mpc (omitting the two farthest galaxies) and dmax = 7 Mpc (including all galaxies in the dataset). To obtain a robust fit, galaxies with ‖vmajj‖2 > 500 km/s were excluded. The overlap model yields the best-fit parameter values from the 2σ regions where the minor and major infall models coincide. |
| In the text | |
|
Fig. 7. Hubble flow fits (Eq. (7)) for the minor (top) and major infall models (bottom) with a starting distance for the fit of dmin = 0.5 Mpc and a maximum distance of galaxies included in the fit of dmax = 7 Mpc (solid lines) and dmax = 4 Mpc (dashed lines). The 1σ confidence bounds around both fits are based on linear propagation of uncertainties for the standard deviations of κH0 and M as given in the table below Fig. 6. |
| In the text | |
|
Fig. 8. Comparison of M 81-group mass estimates of this work using the Hubble flow, virial, and projected mass methods (blue circles, green squares, and orange diamonds, respectively), together with mass estimates from the literature. The vertical dashed grey line and shaded band indicate the weighted mean and 1σ uncertainty of the three estimates of this work. For comparison, literature values are shown: Hubble flow analyses by Del Popolo et al. (2021), Del Popolo & Chan (2022), Peirani & de Freitas Pacheco (2008), and Karachentsev et al. (2002), Karachentsev & Kashibadze (2006); virial and projected pass estimates from Karachentsev et al. (2002); and the most recent projected mass by Karachentsev & Kashibadze (2021). |
| In the text | |
|
Fig. C.1. The infall velocities for all 72 galaxies in our dataset with respect to the barycentre of the M 81 complex located on the connection line between M 81 and M 82, including velocity corrections for the observers’ motion within the Local Group. The galaxies are sorted with increasing distance from M 81 from left to right. The minor infall model velocities are marked in blue, major infall velocities in red, and just taking the difference between the line-of-sight velocities of the barycentre and a galaxy j are marked in black. |
| In the text | |
Current usage metrics show cumulative count of Article Views (full-text article views including HTML views, PDF and ePub downloads, according to the available data) and Abstracts Views on Vision4Press platform.
Data correspond to usage on the plateform after 2015. The current usage metrics is available 48-96 hours after online publication and is updated daily on week days.
Initial download of the metrics may take a while.