Fig. 13
Download original image
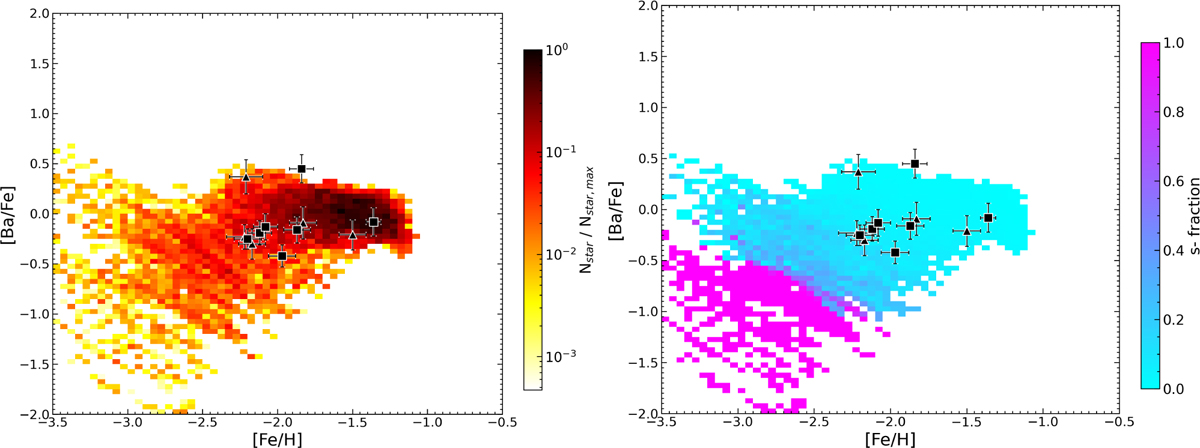
[Ba/Fe] abundances as a function of [Fe/H] as predicted by our adopted stochastic chemical evolution model. On the left panel, the colormap displays the number density of predicted long-lived stars by the model on a logarithmic scale. On the right panel, the colormap displays the fraction of element abundance produced by s-process over total. Black symbols are as in Fig. 12.
Current usage metrics show cumulative count of Article Views (full-text article views including HTML views, PDF and ePub downloads, according to the available data) and Abstracts Views on Vision4Press platform.
Data correspond to usage on the plateform after 2015. The current usage metrics is available 48-96 hours after online publication and is updated daily on week days.
Initial download of the metrics may take a while.