Fig. 2
Download original image
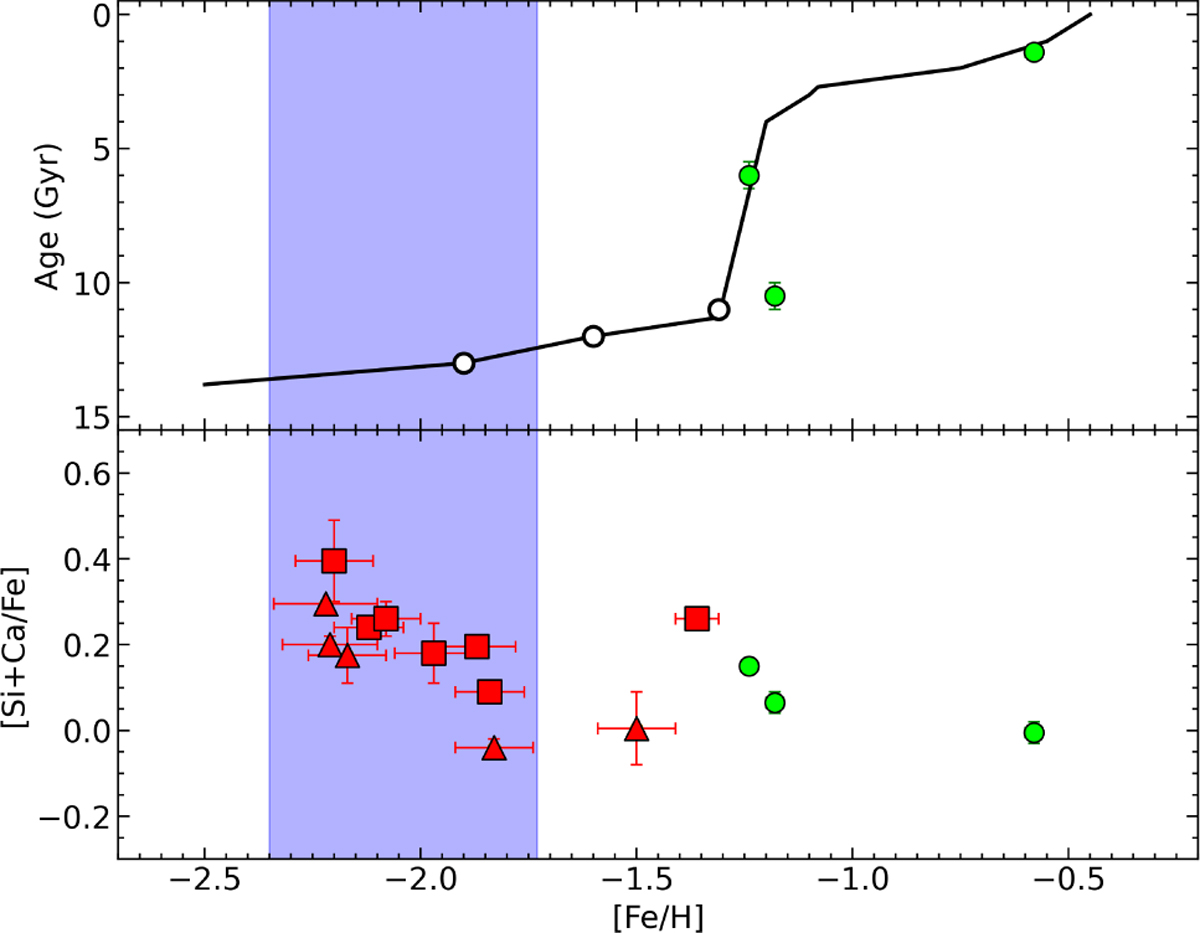
Upper panel: theoretical AMR of the SMC (black line, Pagel & Tautvaisiene 1998), superimposed with the SMC GCs (Paper II, green circles). The white dots mark the position on the theoretical AMR of ages 11, 12 and 13 Gyr. Lower panel: average Si and Ca abundances as a function of [Fe/H] for SMC stars of this work observed with UVES (red squares) and MIKE (red triangles). The blue shaded area highlights the [Fe/H] region of the stars of our sample with −2.2 < [Fe/H] < −1.8 dex.
Current usage metrics show cumulative count of Article Views (full-text article views including HTML views, PDF and ePub downloads, according to the available data) and Abstracts Views on Vision4Press platform.
Data correspond to usage on the plateform after 2015. The current usage metrics is available 48-96 hours after online publication and is updated daily on week days.
Initial download of the metrics may take a while.