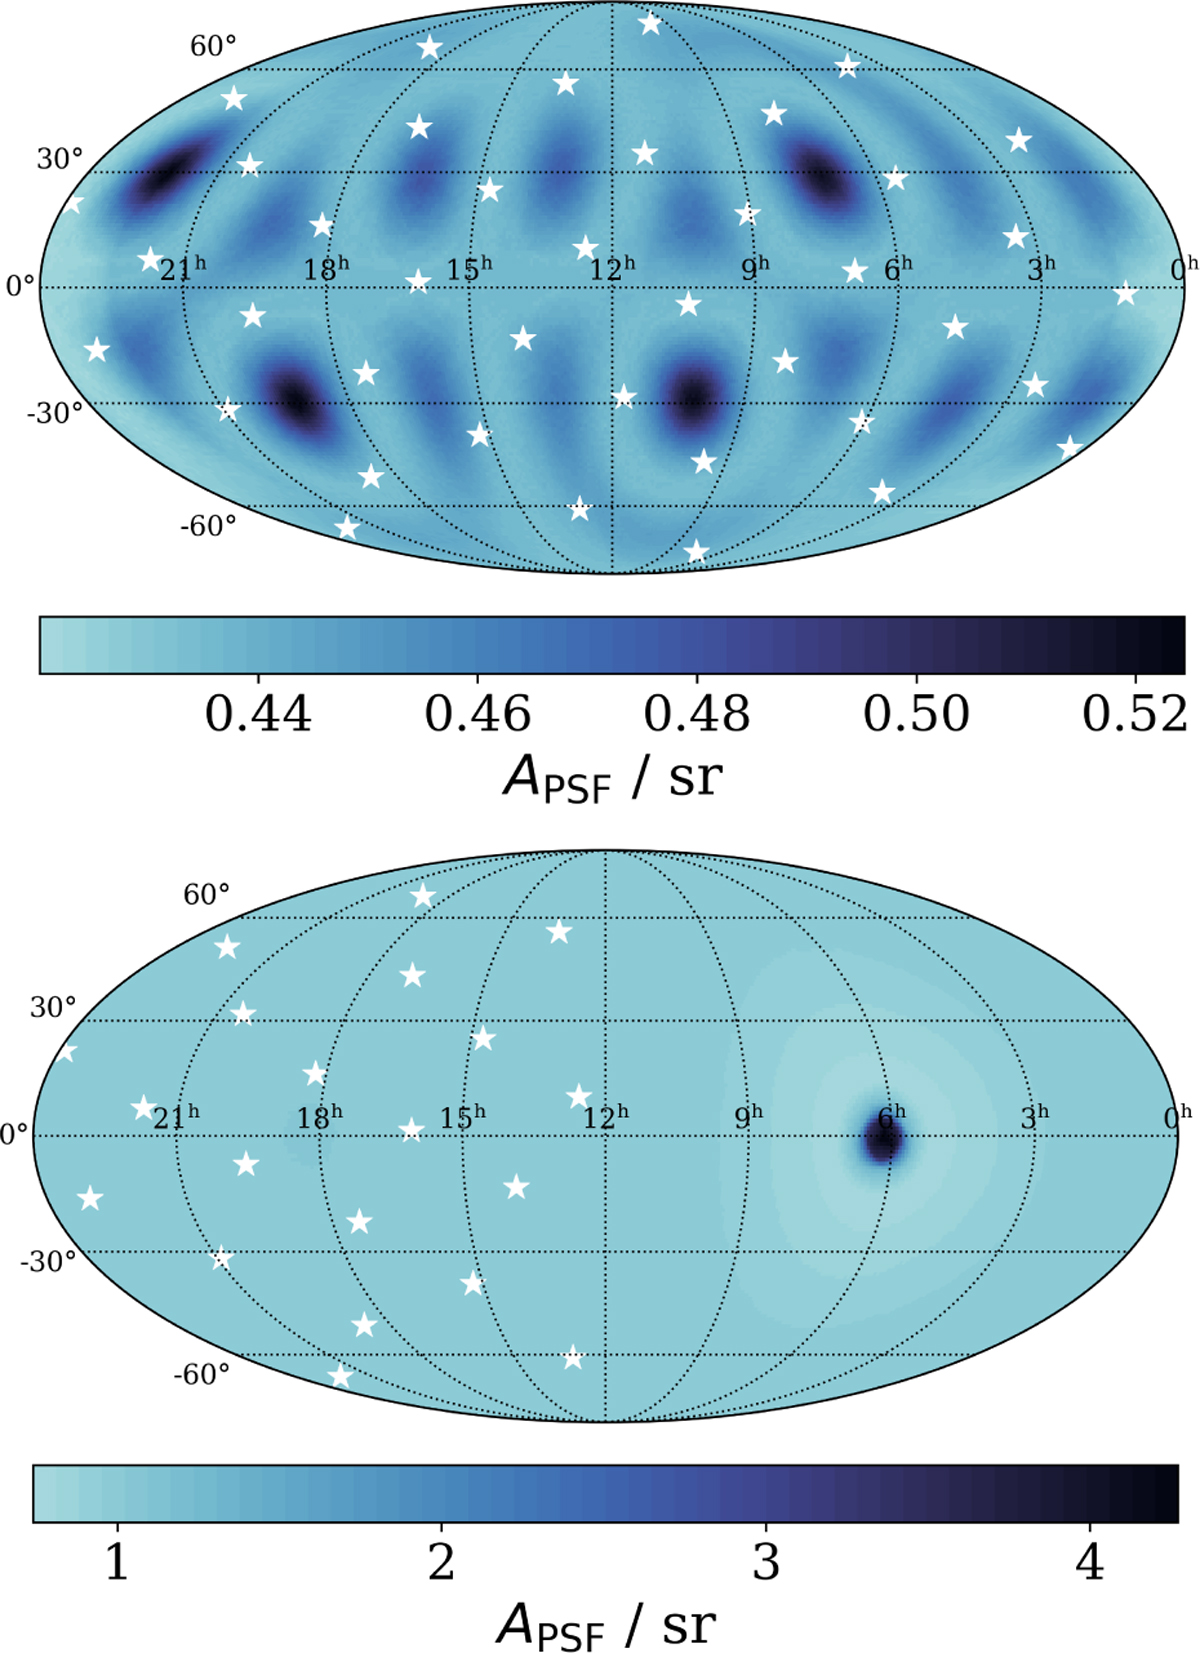
Fig. 2
Download original image
Sky maps showing the (S/N-based) PSF of the PTA as a function of sky position. The white stars indicate the positions of the pulsars in the respective PTA. Both plots were calculated using the classic spherical harmonics expansion scheme based on the number of pulsars. Top: 40 pulsar PTA, ℓmax = 5, sreg = 35. Bottom: 20 pulsar subset PTA, ℓmax = 3, sreg = 15.
Current usage metrics show cumulative count of Article Views (full-text article views including HTML views, PDF and ePub downloads, according to the available data) and Abstracts Views on Vision4Press platform.
Data correspond to usage on the plateform after 2015. The current usage metrics is available 48-96 hours after online publication and is updated daily on week days.
Initial download of the metrics may take a while.