Open Access
Fig. A.2.
Download original image
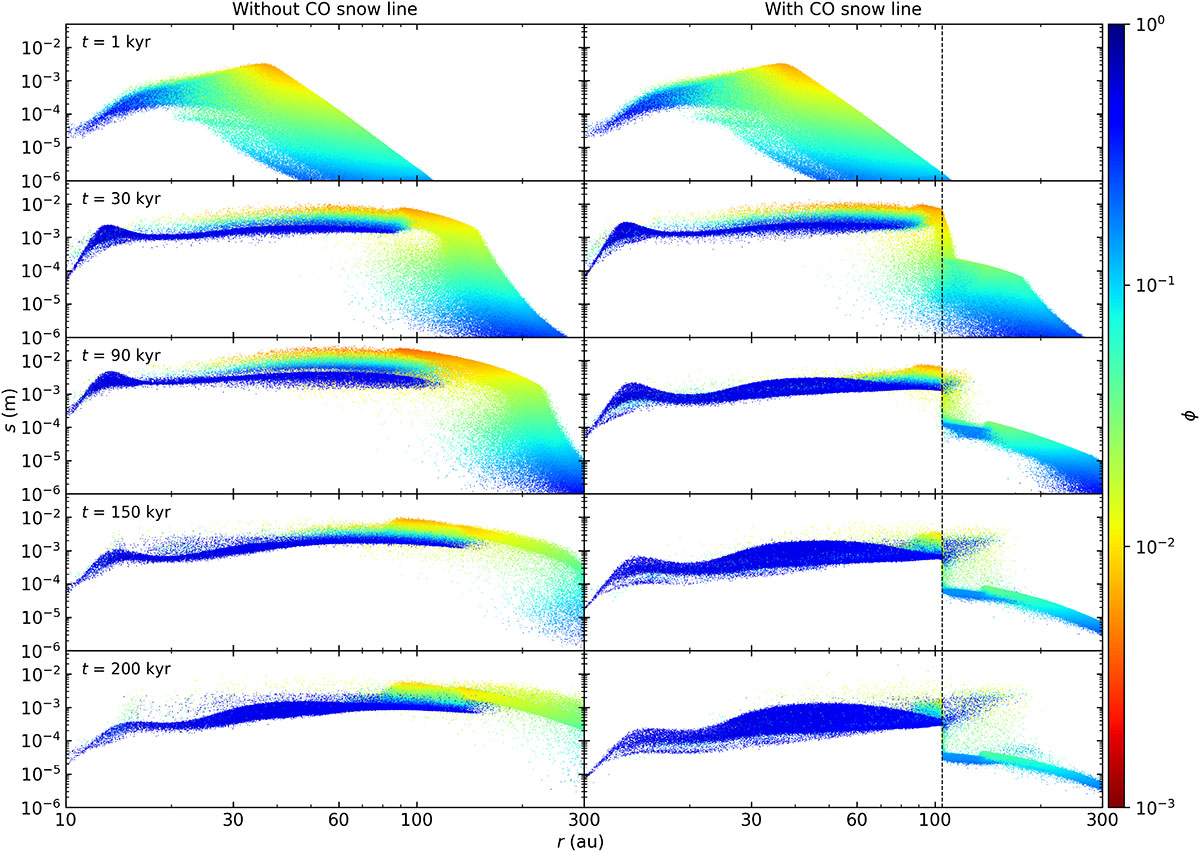
Radial grain size distribution. The colours represent the filling factor, ϕ, in simulations without (left column) and with the CO snow line (right column), which is marked with a vertical dashed line. Time evolution is shown from top to bottom from t = 1 to 200 kyr.
Current usage metrics show cumulative count of Article Views (full-text article views including HTML views, PDF and ePub downloads, according to the available data) and Abstracts Views on Vision4Press platform.
Data correspond to usage on the plateform after 2015. The current usage metrics is available 48-96 hours after online publication and is updated daily on week days.
Initial download of the metrics may take a while.