| Issue |
A&A
Volume 706, February 2026
|
|
|---|---|---|
| Article Number | L14 | |
| Number of page(s) | 8 | |
| Section | Letters to the Editor | |
| DOI | https://doi.org/10.1051/0004-6361/202557914 | |
| Published online | 10 February 2026 | |
Letter to the Editor
The CO snow line favours strong clumping by the streaming instability in protoplanetary discs with porous grains
Université Claude Bernard Lyon 1, CRAL UMR5574, ENS de Lyon, CNRS 69622 Villeurbanne, France
★ Corresponding author: This email address is being protected from spambots. You need JavaScript enabled to view it.
Received:
30
October
2025
Accepted:
24
January
2026
Abstract
Context. The radial drift and fragmentation of small dust grains in protoplanetary discs impedes their growth past centimetre sizes. Several mechanisms have been proposed to overcome these planet formation barriers, such as dust porosity or the streaming instability (SI), which is today regarded as the most promising mechanism to form planetesimals.
Aims. Here, we examine whether the conditions for the SI to lead to strong clumping (the first step in planetesimal formation) are realised in protoplanetary discs containing porous grains.
Methods. We used results from previous simulations of the evolution of porous grains subjected to growth, fragmentation, compaction, and bouncing in protoplanetary discs. In the ensuing disc structures, we determined the regions where the dust-to-gas ratio exceeds the critical value for strong clumping found in simulations of the SI including external turbulence.
Results. We find that the conditions for strong clumping are met within the first hundred thousand years in large regions of protoplanetary discs containing porous grains, provided that the CO snow line is taken into account. If the CO snow line is neglected, the conditions are only met very close to the inner disc edge early on or over large areas well after 200 000 yr.
Key words: methods: numerical / planets and satellites: formation / protoplanetary disks
© The Authors 2026
 Open Access article, published by EDP Sciences, under the terms of the Creative Commons Attribution License (https://creativecommons.org/licenses/by/4.0), which permits unrestricted use, distribution, and reproduction in any medium, provided the original work is properly cited.
This article is published in open access under the Subscribe to Open model. This email address is being protected from spambots. You need JavaScript enabled to view it. to support open access publication.
1. Introduction
In the core accretion paradigm (Pollack et al. 1996; Alibert et al. 2005), planet formation is thought to proceed from the growth of sub-micrometre-sized dust particles into larger and larger solids. Small grains easily stick to each other upon collision up to centimetre-sized pebbles thanks to van der Waals forces, and kilometre-sized planetesimals can rapidly coalesce into planetary cores, and ultimately planets, due to gravity. However, the stage from pebbles to planetesimals is hindered by several processes known as barriers to planet formation. As dust grains grow, their relative velocities increase (Weidenschilling & Cuzzi 1993). Above a threshold velocity, vfrag, grains shatter because of excess kinetic energy. This is the fragmentation barrier (Blum & Wurm 2008). Near this limit, grains only bounce without growing. This is the bouncing barrier (Zsom et al. 2010). In both cases, which occur at near-pebble sizes, grains cannot contribute to the formation of larger bodies. Furthermore, solid bodies immersed in a gas disc are subject to aerodynamic drag, which causes them to drift inwards (Whipple 1972). The importance of drag is quantified by the Stokes number St, defined as the ratio of the drag stopping time to the particle’s orbital time. Small grains, with St ≪ 1, are strongly coupled to the gas and mostly follow its motion. Large solids, with St ≫ 1, are largely decoupled and orbit the star independently of the gas. Particles in the intermediate regime (St ∼ 1) are also mostly of pebble sizes and undergo the most efficient drift, often reaching the star before growing further. This is the radial-drift barrier (Adachi et al. 1976; Weidenschilling 1977).
Solving these problems requires mechanisms that allow particles to reach large St values and decouple from the gas before experiencing significant drift. This can be achieved either by accelerating dust growth or by slowing down radial drift. Taking into account grain porosity explores the former. Porous grains have been observed in Solar System asteroids (Consolmagno et al. 2008) and comets (Güttler et al. 2019) as well as in protoplanetary discs (e.g. Kataoka et al. 2016; Pinte et al. 2019; Tazaki et al. 2023), where Liu et al. (2024) additionally showed that taking into account porous dust opacities may alleviate the dust mass budget problem. Laboratory and numerical experiments have also shown that collisions of small grains regularly form porous aggregates (Blum & Wurm 2000). For a given mass, porous grains have a larger collisional cross-section and thus grow faster than their compact counterparts. While the latter mostly stay in the Epstein drag regime, in which St ∝ s (with s as the grain size), the former can reach the Stokes regime, where St ∝ s2, and thus attain large St values and decouple sooner (Ormel et al. 2007; Okuzumi et al. 2012; Garcia & Gonzalez 2020). Recently, we have shown in numerical simulations of grain evolution that taking into account porosity and compaction during fragmentation is necessary to reproduce observed grain properties in discs (Michoulier et al. 2024a, hereafter Paper I).
As stated, a second class of solutions involves slowing down or stopping radial drift. Dust particles drift towards pressure maxima in the disc (Whipple 1972), accumulating there in so-called dust traps. Their confinement keeps their relative velocities lower than the bouncing and fragmentation thresholds, allowing them to grow unhindered. Various phenomena can cause such traps, and they have been extensively studied, for example, vortices (Meheut et al. 2012), planet gap edges (Paardekooper & Mellema 2004; Fouchet et al. 2007, 2010), snow lines (Kretke & Lin 2007; Vericel & Gonzalez 2020), and self-induced dust traps (Gonzalez et al. 2015, 2017; Vericel et al. 2021).
Finally, instabilities can lead to the direct formation of planetesimals. The most famous one is the streaming instability (SI), discovered by Youdin & Goodman (2005). The SI is a hydrodynamic instability caused by the relative drift of gas and dust, which grows faster when the local dust-to-gas ratio (ε = ρd/ρg, where ρd and ρg are the volume densities of dust and gas, respectively) is high (typically 0.1−1 or more) and the dust coupling to the gas is marginal (St ≲ 1). Physical interpretations for the SI have been detailed by Squire & Hopkins (2020), Magnan et al. (2024). The linear growth of the instability has been studied analytically (Youdin & Goodman 2005; Youdin & Johansen 2007; Jacquet et al. 2011; Auffinger & Laibe 2018; Jaupart & Laibe 2020) and leads to enhancements in the particle density. Its non-linear growth has been investigated via shearing-box simulations (Johansen & Youdin 2007; Schäfer et al. 2017; Yang et al. 2017) and results in the spontaneous concentration of dust into clumps. If their self-gravity is large enough, these clumps can gravitationally collapse and directly form planetesimals (Johansen et al. 2007). Additionally, the SI provides an explanation for the formation and demographics of rocky bodies in the Solar System (Li et al. 2019). It is currently considered the leading mechanism to form planetesimals in protoplanetary discs (Lesur et al. 2023).
The conditions leading to strong particle clumping have been actively investigated (Johansen et al. 2009; Bai & Stone 2010; Carrera et al. 2015; Yang et al. 2017). The metallicity Z = Σd/Σg, defined as the ratio of the dust-to-gas column densities1, needs to exceed a critical value, which has been found to be Zcrit ∼ 0.02 for St ∼ 0.1 and higher for smaller or larger St. With higher-resolution simulations, Li & Youdin (2021), Lim et al. (2025) found reduced values of Zcrit, down to 0.004 for the optimal St. However, by including particle self-gravity and external turbulence, (Lim et al. 2024) found that Zcrit is increased by up to one order of magnitude. In any case, whether these criteria are met in real discs has not yet been verified.
In this Letter, we assess the viability of the SI in protoplanetary discs with porous dust grains using the simulations of porous dust evolution presented in Paper I. The strong clumping criteria are expressed in terms of St, which depends both on grain size, s, and filling factor, ϕ (see Garcia & Gonzalez 2020). Our simulations, providing both s and ϕ, allowed us to directly compute St anywhere in the disc, thus lifting the degeneracy between s and ϕ. We present our methods in Sect. 2 and our results in Sect. 3, and we discuss them in Sect. 4. We conclude in Sect. 5.
2. Methods
In Paper I, we presented our grain porosity evolution model, applied it to a suite of simulations of a gas and dust protoplanetary disc with the 3D smoothed particle hydrodynamics (SPH) code PHANTOM (Price et al. 2018), and extensively discussed the results. Here, we exploit a subset of those simulations that best reproduce observations, and they include compaction during fragmentation (see Paper I for details). Focussing on porous silicate grains, we selected two cases: without (simulation GBFc-Si-a02-Vf20) and with (GBFcS-Si-a02-Vf205) the CO snow line.
We recall the simulation setup here: The 0.01 M⊙ disc with a radial extent from 10 to 400 au, a surface density profile of Σ ∝ (r/r0)−0.75, and a temperature profile of T ∝ (r/r0)−0.5 orbits a 1 M⊙ star. Its aspect ratio is (H/R)0 = 0.0895 at r0 = 100 au, and we used a turbulent viscosity parameter (Shakura & Sunyaev 1973) α = 5 × 10⁻³. Grains of intrinsic density ρs = 2700 kg m−3 and fragmentation threshold vfrag = 20 m s−1 are initially micrometre-sized, with a uniform dust-to-gas ratio of ε0 = 0.01. Beyond the CO snow line at T = 20 K (r ≳ 100 au in our disc), the CO ice coating is assumed to reduce vfrag to 5 m s−1. The simulations comprised 1.2 million SPH particles in the ‘dust-as-mixture’ formalism and were evolved for 300 000 yr. We refer to Paper I for more information on the simulation suite and setup.
The results of our global 3D simulations are recalled in Appendix A. As is the case with all SPH simulations to date (David-Cléris 2024), they lacked the resolution needed to capture the SI. Therefore, in this Letter, we investigate whether strong clumping by the SI can occur in our simulated disc by examining if the required conditions were met in our two cases. Unlike most authors, we did not use the critical metallicity Zcrit, which involves vertically integrated surface densities. Instead, we preferred to rely on the local dust-to-gas ratio (ε) computed from volume densities. Indeed, we thought it to be more relevant to studying conditions at different altitudes above the midplane in the presence of dust settling. We adopted the critical value found by Lim et al. (2024) and given by
 (1)
(1)
which they found to be mostly insensitive to the levels of turbulence they studied, contrary to Zcrit. We considered that strong clumping occurred in the disc regions where ε > εcrit.
3. Results
We examined the conditions for strong clumping by the SI using Fig. 1, which displays the locations of the SPH particles in the St–ε plane at t = 150 kyr. Their colour represents their radial distance to the star. The solid line plots εcrit from Eq. (1). We also show for reference (with a dashed line) the critical curve εLY21 from Li & Youdin (2021), which is widely used but neglects external turbulence. In the disc without CO snow line, the conditions for strong clumping are met only in a small fraction of the disc, at its inner edge (yellow points). However, with the CO snow line, the disc areas with strong clumping extend from the disc inner edge out to its intermediate regions (purple points).
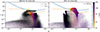 |
Fig. 1. Positions of the SPH particles in the St–ε plane, coloured by their radial distance to the star r, at t = 150 000 yr in simulations without (left) and with (right) the CO snow line. The solid and dashed lines show the critical dust-to-gas ratios εcrit from Lim et al. (2024) and εLY21 from Li & Youdin (2021), respectively. |
The precise locations of the disc regions where strong clumping can occur are better viewed in meridian plane maps of the areas where ε > εcrit, shown in Fig. 2, again at t = 150 kyr. Without the CO snow line (left), the strong-clumping region is limited to the inner disc interior to ∼15 au. In the disc with the CO snow line (right), the region spreads from the inner edge out to ∼80 au. It includes two zones that have a larger dust-to-gas ratio and peak values as high as approximately five, centred around ∼15 and ∼40 au. The outer one reaches a couple of astronomical units above the midplane.
 |
Fig. 2. Map of the dust-to-gas ratio (ε) where it exceeds εcrit in the meridian plane (r, z) at t = 150 000 yr in simulations without (left) and with the CO snow line, marked by the vertical dashed line (right). The extent of the gas disc is shown in light grey. |
The time evolution of the strong-clumping regions is shown in Appendix B. The inner one forms early on, at 20 kyr, interior to 15 au in both cases. With the CO snow line, an outer strong-clumping region forms near 40 au at 70 kyr, and the two regions expand and merge at 150 kyr. At later times, without the CO snow line, the strong-clumping region at the disc inner edge shrinks and disappears, while a second region starts to grow around 35 au. By 300 kyr, the latter extends from ∼25 to ∼90 au, with peak values of ε ≳ 5. In contrast, with the CO snow line, the strong-clumping region evolves only slightly in the radial direction but thickens, with a dust-to-gas ratio that continues to increase.
4. Discussion
Strong clumping by the SI requires ε to become larger than εcrit. Dust trapping is an efficient mechanism to increase ε (see Sect. 1). Dust from infalling envelopes can also lead to dust-enriched regions in the embedded disc phase (Cridland et al. 2022). In our discs, the increase in ε is due to a combination of the vertical settling and radial drift of growing dust. When the CO snow line is not included, grains drift fast (because of their large St; see Appendix A) from the outer disc until St drops to a few percent, and they slow down and pile up interior to ∼15 au, where ε exceeds unity. Later on, the ongoing grain compaction lowers the St of the grains at progressively larger distances from the star, resulting in the appearance of a second strong-clumping region at intermediate distances. When it is present, the CO snow line acts as a barrier that slowly feeds the disc interior to it, preventing grains from growing too fast and limiting their St to at most 0.1. The grains drift more slowly and accumulate where St decreases, which is farther out than in the previous case, resulting early on in a region of enhanced ε tens of astronomical units from the star. Over time, this region grows slowly, merges with the inner one, and becomes more dust-enriched.
Planetesimal formation also needs large areas where strong clumping can occur. Indeed, if these areas are too narrow, drifting grains can cross them faster than the SI can grow (Carrera & Simon 2022). This can be an issue at early stages without a CO snow line. However, the more realistic case, which includes all relevant processes (grain porosity, growth, fragmentation with compaction, bouncing, and the CO snow line), is also the most favourable, with an early development of extended areas conducive to planetesimal formation. This is supported by a crude estimate of their available mass reservoir (see Appendix C).
Besides those inherent to our dust evolution model and extensively discussed in Paper I, the main caveat in this work is that the condition for strong clumping that we used, ε > εcrit, was derived for the monodisperse SI (mSI), i.e. considering only one St value at a time. Yet, our simulations of dust evolution include a wide range of grains sizes, and therefore of St numbers. Studies of the SI taking into account a particle size distribution (polydisperse SI) have found that growth rates are much lower than for the mSI (Krapp et al. 2019; Paardekooper et al. 2020; Matthijsse et al. 2025). However, the linear growth for size distributions peaking at the largest grains if ε ≳ 1 (McNally et al. 2021) and the non-linear saturation states in the fast-growth regime (Yang & Zhu 2021) are similar to those of the mSI. When coagulation is taken into account, dust growth and the SI can assist each other in a positive feedback loop (Tominaga & Tanaka 2023; Carrera et al. 2025), which can help the dust-to-gas ratio rise above critical values. The situation becomes more complex in the presence of magnetic fields. Lin & Hsu (2022) found that the mSI can be stabilised by magnetic perturbations, particularly when ε is low. However, exploratory work of the magnetised polydisperse SI (David-Cléris 2024) has suggested that the presence of a magnetic field makes the SI more robust to polydisperse dampening. In any case, simulations aiming to determine the criteria for strong clumping by the polydisperse SI would be very valuable to more realistically assessing where planetesimals can form.
5. Conclusion
We have used simulations of the dynamics of porous dust experiencing growth, fragmentation, bouncing, and compaction in protoplanetary discs that we ran in Paper I to explore if and where the conditions for strong clumping by the SI are met. We find that the evolution of porous grains results in a strong-clumping region limited to the disc interior to 15 au for ∼200 kyr. It is only when the CO snow line, which helps retain more large grains in the disc, is taken into account that the situation brightens, with the early appearance of strong clumping extending over a large area out to a few tens of astronomical units. The presence of the CO snow line thus appears to be key to promoting planetesimal formation in discs with porous grains. While the physical mechanism is different, its importance can be related to that of the water snow line much closer in (Drążkowska & Alibert 2017). In future work, we envision performing simulations of the SI in dusty discs together with porous grain evolution using the newly released GPU-accelerated SHAMROCK code (David-Cléris et al. 2025).
Acknowledgments
We thank Antoine Alaguero, Daniel Carrera, Timothée David-Cléris and Guillaume Laibe for fruitful discussions, as well as the anonymous referee, whose report helped improve this Letter. The authors acknowledge funding from ANR (Agence Nationale de la Recherche) of France under contract number ANR-16-CE31-0013 (Planet-Forming-Disks) and thank the LABEX Lyon Institute of Origins (ANR-10-LABX-0066) for its financial support within the Plan France 2030 of the French government operated by the ANR. This research was partially supported by the Programme National de Physique Stellaire and the Programme National de Planétologie of CNRS (Centre National de la Recherche Scientifique)/INSU (Institut National des Sciences de l’Univers), France. This project has received funding from the European Union’s Horizon 2020 research and innovation programme under the Marie Skłodowska-Curie grant agreements Nos 210021 and 823823 (DUSTBUSTERS). We gratefully acknowledge support from the CBPsmn (PSMN, Pôle Scientifique de Modélisation Numérique) of the ENS de Lyon for the computing resources. The platform operates the SIDUS solution (Quemener & Corvellec 2013) developed by Emmanuel Quemener. Figures were made with the Python library matplotlib (Hunter 2007). The data necessary to recreate the PHANTOM simulations and to reproduce the figures are available in Michoulier et al. (2024b).
References
- Adachi, I., Hayashi, C., & Nakazawa, K. 1976, Progr. Theor. Phys., 56, 1756 [Google Scholar]
- Alibert, Y., Mordasini, C., Benz, W., & Winisdoerffer, C. 2005, A&A, 434, 343 [NASA ADS] [CrossRef] [EDP Sciences] [Google Scholar]
- Auffinger, J., & Laibe, G. 2018, MNRAS, 473, 796 [Google Scholar]
- Bai, X.-N., & Stone, J. M. 2010, ApJ, 722, 1437 [NASA ADS] [CrossRef] [Google Scholar]
- Blum, J., & Wurm, G. 2000, Icarus, 143, 138 [NASA ADS] [CrossRef] [Google Scholar]
- Blum, J., & Wurm, G. 2008, ARA&A, 46, 21 [Google Scholar]
- Carrera, D., & Simon, J. B. 2022, ApJ, 933, L10 [NASA ADS] [CrossRef] [Google Scholar]
- Carrera, D., Johansen, A., & Davies, M. B. 2015, A&A, 579, A43 [NASA ADS] [CrossRef] [EDP Sciences] [Google Scholar]
- Carrera, D., Lim, J., Eriksson, L. E. J., Lyra, W., & Simon, J. B. 2025, A&A, 696, L23 [NASA ADS] [CrossRef] [EDP Sciences] [Google Scholar]
- Consolmagno, G., Britt, D., & Macke, R. 2008, Chemie der Erde/Geochemistry, 68, 1 [Google Scholar]
- Cridland, A. J., Rosotti, G. P., Tabone, B., et al. 2022, A&A, 662, A90 [NASA ADS] [CrossRef] [EDP Sciences] [Google Scholar]
- David-Cléris, T. 2024, Ph.D. Thesis, Université de Lyon [Google Scholar]
- David-Cléris, T., Laibe, G., & Lapeyre, Y. 2025, MNRAS, 539, 1 [Google Scholar]
- Drążkowska, J., & Alibert, Y. 2017, A&A, 608, A92 [Google Scholar]
- Fouchet, L., Maddison, S. T., Gonzalez, J. F., & Murray, J. R. 2007, A&A, 474, 1037 [NASA ADS] [CrossRef] [EDP Sciences] [Google Scholar]
- Fouchet, L., Gonzalez, J. F., & Maddison, S. T. 2010, A&A, 518, A16 [NASA ADS] [CrossRef] [EDP Sciences] [Google Scholar]
- Garcia, A. J. L., & Gonzalez, J.-F. 2020, MNRAS, 493, 1788 [Google Scholar]
- Gonzalez, J. F., Laibe, G., Maddison, S. T., Pinte, C., & Ménard, F. 2015, MNRAS, 454, L36 [NASA ADS] [CrossRef] [Google Scholar]
- Gonzalez, J. F., Laibe, G., & Maddison, S. T. 2017, MNRAS, 467, 1984 [NASA ADS] [Google Scholar]
- Güttler, C., Mannel, T., Rotundi, A., et al. 2019, A&A, 630, A24 [NASA ADS] [CrossRef] [EDP Sciences] [Google Scholar]
- Hunter, J. D. 2007, Comput. Sci. Eng., 9, 90 [NASA ADS] [CrossRef] [Google Scholar]
- Jacquet, E., Balbus, S., & Latter, H. 2011, MNRAS, 415, 3591 [NASA ADS] [CrossRef] [Google Scholar]
- Jaupart, E., & Laibe, G. 2020, MNRAS, 492, 4591 [Google Scholar]
- Johansen, A., & Youdin, A. 2007, ApJ, 662, 627 [Google Scholar]
- Johansen, A., Oishi, J. S., Mac Low, M.-M., et al. 2007, Nature, 448, 1022 [Google Scholar]
- Johansen, A., Youdin, A., & Mac Low, M.-M. 2009, ApJ, 704, L75 [NASA ADS] [CrossRef] [Google Scholar]
- Kataoka, A., Muto, T., Momose, M., Tsukagoshi, T., & Dullemond, C. P. 2016, ApJ, 820, 54 [Google Scholar]
- Krapp, L., Benítez-Llambay, P., Gressel, O., & Pessah, M. E. 2019, ApJ, 878, L30 [Google Scholar]
- Kretke, K. A., & Lin, D. N. C. 2007, ApJ, 664, L55 [CrossRef] [Google Scholar]
- Lesur, G., Flock, M., Ercolano, B., et al. 2023, ASP Conf. Ser., 534, 465 [NASA ADS] [Google Scholar]
- Li, R., & Youdin, A. N. 2021, ApJ, 919, 107 [NASA ADS] [CrossRef] [Google Scholar]
- Li, R., Youdin, A. N., & Simon, J. B. 2019, ApJ, 885, 69 [NASA ADS] [CrossRef] [Google Scholar]
- Lim, J., Simon, J. B., Li, R., et al. 2024, ApJ, 969, 130 [NASA ADS] [CrossRef] [Google Scholar]
- Lim, J., Simon, J. B., Li, R., et al. 2025, ApJ, 981, 160 [Google Scholar]
- Lin, M.-K., & Hsu, C.-Y. 2022, ApJ, 926, 14 [NASA ADS] [CrossRef] [Google Scholar]
- Liu, Y., Roussel, H., Linz, H., et al. 2024, A&A, 692, A148 [NASA ADS] [CrossRef] [EDP Sciences] [Google Scholar]
- Magnan, N., Heinemann, T., & Latter, H. N. 2024, MNRAS, 534, 3944 [NASA ADS] [CrossRef] [Google Scholar]
- Matthijsse, J., Aly, H., & Paardekooper, S.-J. 2025, A&A, 695, A158 [NASA ADS] [CrossRef] [EDP Sciences] [Google Scholar]
- McNally, C. P., Lovascio, F., & Paardekooper, S.-J. 2021, MNRAS, 502, 1469 [NASA ADS] [CrossRef] [Google Scholar]
- Meheut, H., Meliani, Z., Varniere, P., & Benz, W. 2012, A&A, 545, A134 [NASA ADS] [CrossRef] [EDP Sciences] [Google Scholar]
- Michoulier, S., Gonzalez, J.-F., & Price, D. J. 2024a, A&A, 688, A31 [NASA ADS] [CrossRef] [EDP Sciences] [Google Scholar]
- Michoulier, S., Gonzalez, J. F., & Price, D. J. 2024b, https://doi.org/10.5281/zenodo.12729015 [Google Scholar]
- Okuzumi, S., Tanaka, H., Kobayashi, H., & Wada, K. 2012, ApJ, 752, 106 [NASA ADS] [CrossRef] [Google Scholar]
- Ormel, C. W., Spaans, M., & Tielens, A. G. G. M. 2007, A&A, 461, 215 [NASA ADS] [CrossRef] [EDP Sciences] [Google Scholar]
- Paardekooper, S. J., & Mellema, G. 2004, A&A, 425, L9 [NASA ADS] [CrossRef] [EDP Sciences] [Google Scholar]
- Paardekooper, S.-J., McNally, C. P., & Lovascio, F. 2020, MNRAS, 499, 4223 [CrossRef] [Google Scholar]
- Pinte, C., van der Plas, G., Ménard, F., et al. 2019, Nat. Astron., 3, 1109 [NASA ADS] [CrossRef] [Google Scholar]
- Pollack, J. B., Hubickyj, O., Bodenheimer, P., et al. 1996, Icarus, 124, 62 [NASA ADS] [CrossRef] [Google Scholar]
- Price, D. J., Wurster, J., Tricco, T. S., et al. 2018, PASA, 35, e031 [Google Scholar]
- Quemener, E., & Corvellec, M. 2013, Linux J., 2013, 3 [Google Scholar]
- Schäfer, U., Yang, C.-C., & Johansen, A. 2017, A&A, 597, A69 [Google Scholar]
- Shakura, N. I., & Sunyaev, R. A. 1973, A&A, 24, 337 [NASA ADS] [Google Scholar]
- Squire, J., & Hopkins, P. F. 2020, MNRAS, 498, 1239 [NASA ADS] [CrossRef] [Google Scholar]
- Tazaki, R., Ginski, C., & Dominik, C. 2023, ApJ, 944, L43 [NASA ADS] [CrossRef] [Google Scholar]
- Tominaga, R. T., & Tanaka, H. 2023, ApJ, 958, 168 [Google Scholar]
- Vericel, A., & Gonzalez, J.-F. 2020, MNRAS, 492, 210 [NASA ADS] [CrossRef] [Google Scholar]
- Vericel, A., Gonzalez, J.-F., Price, D. J., Laibe, G., & Pinte, C. 2021, MNRAS, 507, 2318 [NASA ADS] [CrossRef] [Google Scholar]
- Weidenschilling, S. J. 1977, MNRAS, 180, 57 [Google Scholar]
- Weidenschilling, S. J., & Cuzzi, J. N. 1993, in Protostars and Planets III, eds. E. H. Levy, & J. I. Lunine, 1031 [Google Scholar]
- Whipple, F. L. 1972, in From Plasma to Planet, ed. A. Elvius, 211 [Google Scholar]
- Yang, C.-C., & Zhu, Z. 2021, MNRAS, 508, 5538 [NASA ADS] [CrossRef] [Google Scholar]
- Yang, C.-C., Johansen, A., & Carrera, D. 2017, A&A, 606, A80 [NASA ADS] [CrossRef] [EDP Sciences] [Google Scholar]
- Youdin, A. N., & Goodman, J. 2005, ApJ, 620, 459 [Google Scholar]
- Youdin, A., & Johansen, A. 2007, ApJ, 662, 613 [Google Scholar]
- Zsom, A., Ormel, C. W., Güttler, C., Blum, J., & Dullemond, C. P. 2010, A&A, 513, A57 [NASA ADS] [CrossRef] [EDP Sciences] [Google Scholar]
Some authors use Z = Σd/(Σg + Σd), which is numerically very close.
Appendix A: Summary of results from Paper I
Figures A.1 and A.2 recall the results from Paper I for the two considered simulations (GBFc-Si-a02-Vf20, left and GBFcS-Si-a02-Vf205, right) at relevant snapshots from t = 1 to 200 kyr. Maps of the grains Stokes number in the meridian plane are displayed in Fig. A.1 while Fig. A.2 shows radial grain size distributions coloured by filling factor. Initial dust growth is fast in the inner (∼10 to ∼30 au) and intermediate (∼30 to ∼100 au) disc regions, with grains reaching a few millimeters in the latter after 1 kyr, while they are still micrometer-sized in the outer disc (exterior to ∼100 au, or outside the CO snow line when it is included). After a few tens of kyr, efficient dust settling is seen except in the outer regions. Interior to ∼100 au, dust evolution remains very similar in both simulations up to t = 30 kyr, when grains have reached sizes of a few millimeters to almost a centimetre in most of the region. In the intermediate disc, large porous grains with ϕ of a few 10−3 coexist with smaller grains that have been compacted to ϕ ∼ 0.3. With St ∼ 0.1, grains drift towards the inner disc edge, slow down where St ∼ 0.02 and pile up (see Appendix B). In the outer disc without the CO snow line (left), grains are in the process of growing to millimeter sizes, while with the CO snow line (right), grains grow less efficiently and to smaller sizes.
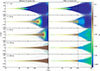 |
Fig. A.1. Map of the Stokes number St in the meridian plane (r, z). The light grey background shows the extent of the gas disc in simulations without (left column) and with the CO snow line (right column), which is marked with a vertical dashed line. Time evolution is shown from top to bottom from t = 1 to 200 kyr. |
Later on, the more fragile grains in the outer disc with the CO snow line stay smaller than 100 μm, with St ≲ 0.02, and drift slowly, thus starving the intermediate and inner disc of already grown dust, where grains grow more slowly and their St remains ∼0.1 at most just inside the CO snow line. Closer in, compaction continues more slowly and St decreases to values ∼0.05 or less, slowing down radial drift in the intermediate disc and causing a second pile-up (see Appendix B). In contrast, without the CO snow line, the grains keep growing in the whole disc and reach their largest sizes of a few centimetres at 90 kyr. The region of drifting grains with St ≳ 0.1 extends in the outer disc. At 150 kyr, grains have reached millimeter sizes and St ≳ 0.2 out to 300 au, with vigorous compaction now in the 80−150 au region. Similarly to the case with the CO snow line, but with a delay exceeding 100 kyr, compaction then proceeds more slowly in the inner disc, reducing St to ∼0.05 at 200 kyr.
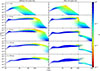 |
Fig. A.2. Radial grain size distribution. The colours represent the filling factor, ϕ, in simulations without (left column) and with the CO snow line (right column), which is marked with a vertical dashed line. Time evolution is shown from top to bottom from t = 1 to 200 kyr. |
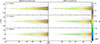 |
Fig. A.3. Same as Fig. A.1, but zoomed in on the disc interior to 90 au to show the late evolution at t = 200, 250, and 300 kyr. |
The subsequent evolution is better seen in Fig. A.3, zooming in on the inner and intermediate disc. Without CO snow line, St keeps decreasing in the intermediate disc, from 0.05−0.1 at 200 kyr around 30−40 au to 0.02−0.05 at 300 kyr. With the CO snow line, the same trend is seen but with values going from 0.02−0.05 at 200 kyr to < 0.02 at 300 kyr. In both cases, this enhances the dust slowdown and pile-up. Dust settling is also increasing in both simulations, similarly delayed in that without CO snow line.
Appendix B: Time evolution of the strong-clumping regions
Figure B.1 shows meridian plane maps of the strong-clumping regions, i.e. where ε > εcrit, at relevant snapshots from t = 20 to 300 kyr. These regions of enhanced dust-to-gas ratio are formed by the accumulation of grains in pile-ups resulting from their evolution. The first of these strong-clumping regions appear near the disc inner edge at 20 kyr, simultaneously in both simulations, as the first pile-up identified in Appendix A. At 70 kyr, the second pile-up, forming only when the CO snow line is present (right), leads to the appearance of a new strong-clumping region spanning the 30−50 au region. In both simulations, the inner one reaches high concentrations, with ε ≳ 5, in a narrow ring at ∼11–12 au. Later on, the St gradient become shallower at the disc inner edge, following the grain size gradient evolution (Fig. A.2), which weakens the inner dust pile-up, faster in the case without the CO snow line (left). With the CO snow line, the outer strong-clumping region expands over time and its dust-to-gas ratio increases, reaching ε ∼ 5 at 150 kyr (Fig. 2) and exceeding 10 after 240 kyr, as dust settling continues. Without CO snow line, the 190 kyr snapshot shows a much weakened inner strong-clumping region (it will disappear by 200 kyr), and the appearance of a new one near 35 au. Its subsequent evolution resembles that of the case with the CO snowline, delayed by over 100 kyr (see Appendix A). At 300 kyr, its peak dust-to-gas ratio is similar to that with the CO snow line at 150 kyr.
Appendix C: Mass reservoir for planetesimal formation
Our simulations cannot capture the SI (see Sect. 2) or the ensuing planetesimal formation. A commonly used recipe to estimate the mass of planetesimals formed by the SI (see e.g. Drążkowska & Alibert 2017, and references therein) is to assume that a fraction of the dust mass meeting the strong-clumping criterion at a given location is converted into planetesimals during each orbital period. This method is unfortunately impractical to use as a post-treatment of our simulations, since it would mean removing a substantial mass of dust grains, thus affecting the dust mass in strong-clumping regions Md, ε > εcrit at later time steps in a non-self-consistent way. This could be done in new dedicated simulations in a future work. However, Md, ε > εcrit can be used as a proxy for the capacity of a disc to form planetesimals. Ideally, one would wish to have a metric for the total mass of planetesimals formed over the disc’s lifetime but using a cumulative measure of Md, ε > εcrit is again impractical as a fraction of dust grains would be counted several times. Despite those caveats, Md, ε > εcrit can still be useful to compare the discs without and with the CO snow line. Its time evolution is shown in Fig. C.1. With the CO snowline, Md, ε > εcrit increases rapidly after 70 kyr, exceeds 10 M⊕ at 90 kyr and reaches 28 M⊕ by 300 kyr. In contrast, without CO snowline, the fast increase of Md, ε > εcrit only starts at 190 kyr, and it exceeds 10 M⊕ only after 250 kyr. The CO snowline thus appears to promote the early formation of planetesimals.
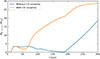 |
Fig. C.1. Time evolution of the dust mass in strong-clumping regions Md, ε > εcrit, in Earth masses, for the discs without (blue) and with (orange) the CO snowline. |
All Figures
|
Fig. 1. Positions of the SPH particles in the St–ε plane, coloured by their radial distance to the star r, at t = 150 000 yr in simulations without (left) and with (right) the CO snow line. The solid and dashed lines show the critical dust-to-gas ratios εcrit from Lim et al. (2024) and εLY21 from Li & Youdin (2021), respectively. |
| In the text | |
|
Fig. 2. Map of the dust-to-gas ratio (ε) where it exceeds εcrit in the meridian plane (r, z) at t = 150 000 yr in simulations without (left) and with the CO snow line, marked by the vertical dashed line (right). The extent of the gas disc is shown in light grey. |
| In the text | |
|
Fig. A.1. Map of the Stokes number St in the meridian plane (r, z). The light grey background shows the extent of the gas disc in simulations without (left column) and with the CO snow line (right column), which is marked with a vertical dashed line. Time evolution is shown from top to bottom from t = 1 to 200 kyr. |
| In the text | |
|
Fig. A.2. Radial grain size distribution. The colours represent the filling factor, ϕ, in simulations without (left column) and with the CO snow line (right column), which is marked with a vertical dashed line. Time evolution is shown from top to bottom from t = 1 to 200 kyr. |
| In the text | |
|
Fig. A.3. Same as Fig. A.1, but zoomed in on the disc interior to 90 au to show the late evolution at t = 200, 250, and 300 kyr. |
| In the text | |
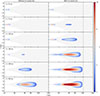 |
Fig. B.1. Same as Fig. 2, but showing its time evolution from t = 20 to 300 kyr, from top to bottom. |
| In the text | |
|
Fig. C.1. Time evolution of the dust mass in strong-clumping regions Md, ε > εcrit, in Earth masses, for the discs without (blue) and with (orange) the CO snowline. |
| In the text | |
Current usage metrics show cumulative count of Article Views (full-text article views including HTML views, PDF and ePub downloads, according to the available data) and Abstracts Views on Vision4Press platform.
Data correspond to usage on the plateform after 2015. The current usage metrics is available 48-96 hours after online publication and is updated daily on week days.
Initial download of the metrics may take a while.