Fig. 1
Download original image
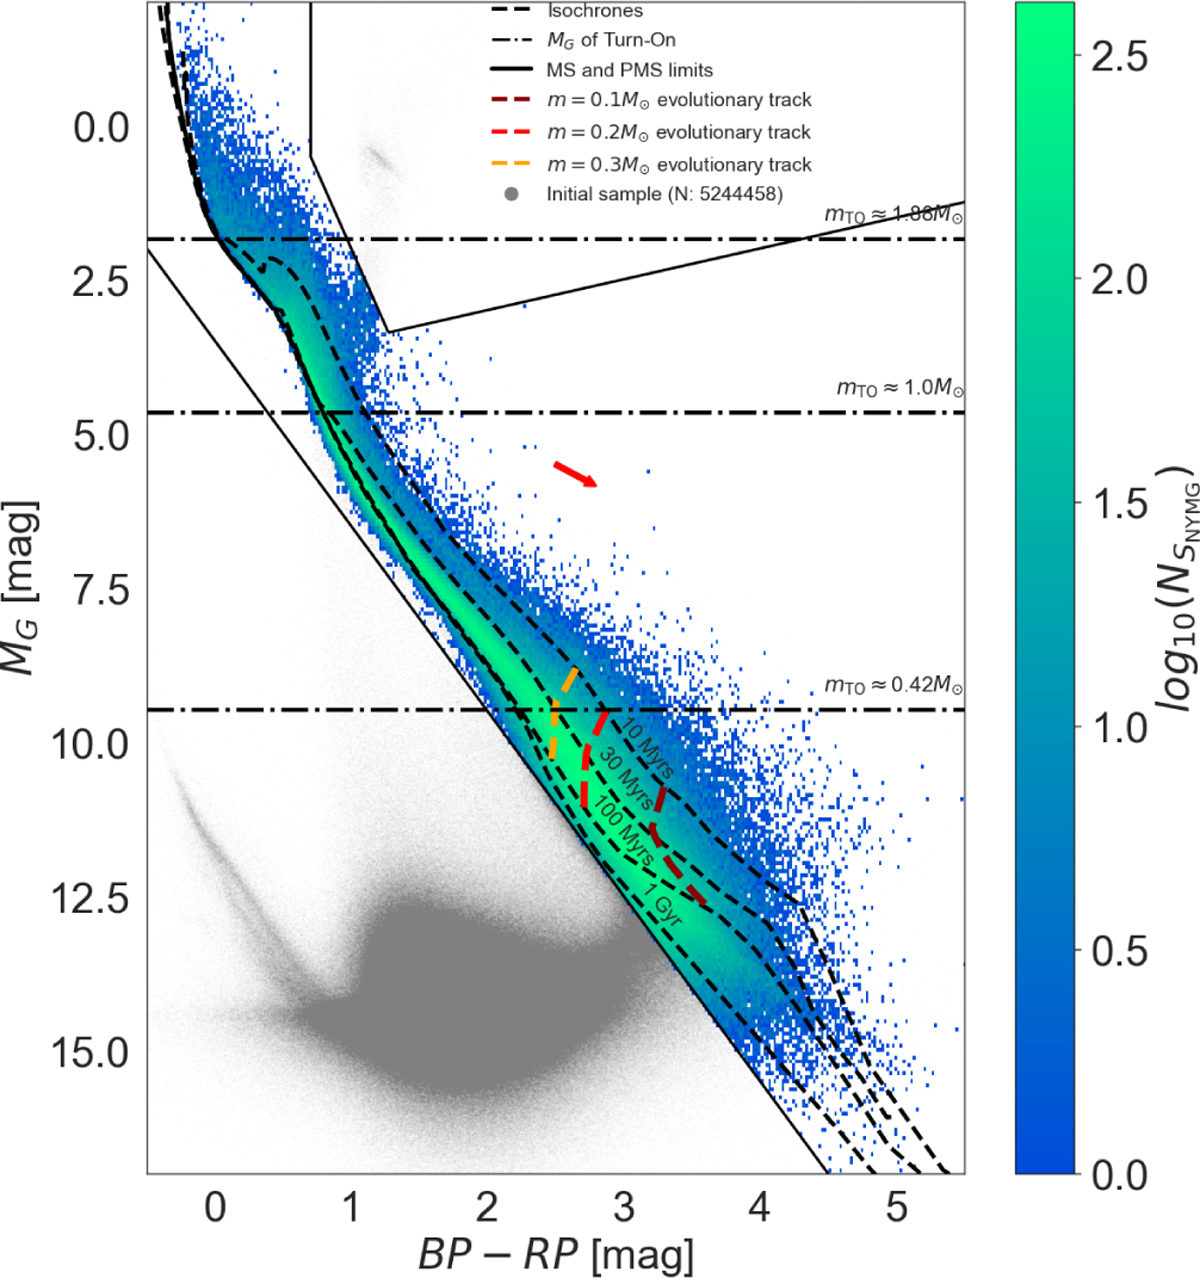
CMD of the starting sample (grey points) and the SNYMG sample (coloured scale indicating the density of points). The solid lines indicate the limits of the MS and PMS locus, the black dashed curves show the isochrones from Phillips et al. (2020), Baraffe et al. (2015), and Marigo et al. (2017) stellar evolutionary models for 10 Myr, 30 Myr, 100 Myr, and 1 Gyr. The horizontal black dash-dotted lines indicate the MG values corresponding to the turn-on (see Sect. 3.5) for the labelled masses. The red, orange, and blue dashed lines indicate the 0.1, 0.2, and 0.3 Μ⊙ evolutionary tracks, respectively. The red arrow indicates twice the extinction vector for an M4 dwarf star with AV = 0.22 mag.
Current usage metrics show cumulative count of Article Views (full-text article views including HTML views, PDF and ePub downloads, according to the available data) and Abstracts Views on Vision4Press platform.
Data correspond to usage on the plateform after 2015. The current usage metrics is available 48-96 hours after online publication and is updated daily on week days.
Initial download of the metrics may take a while.