Fig. 10
Download original image
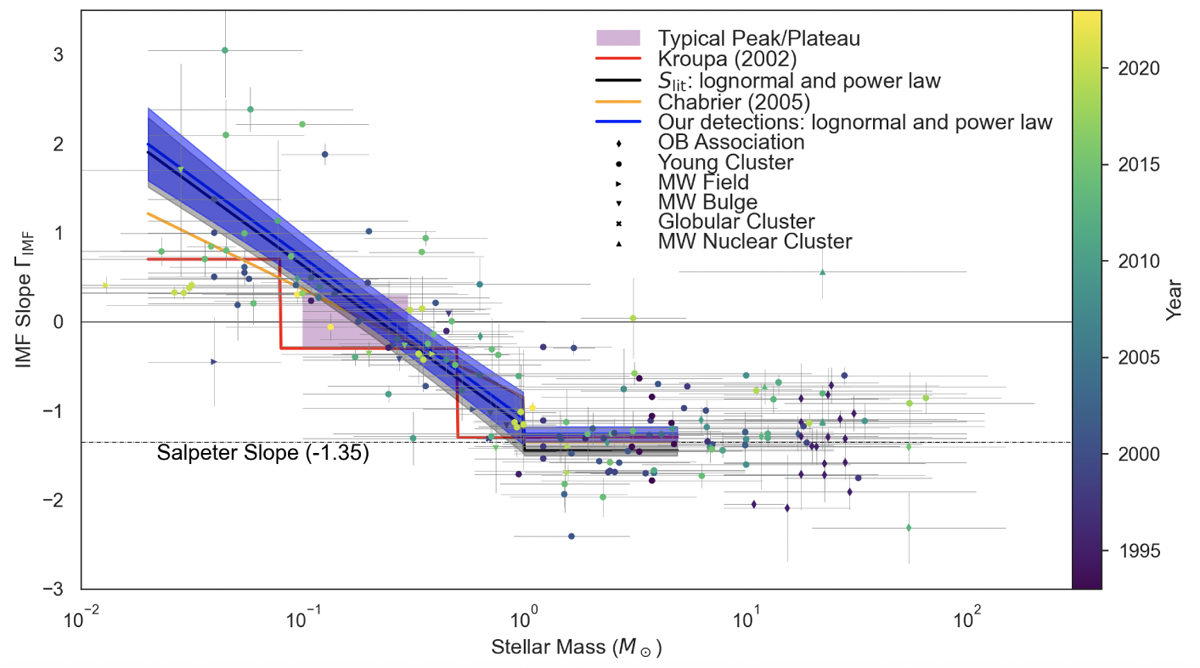
Figure taken from Hennebelle & Grudić (2024) review on the IMF overlapped with the parametrisation of the mean-normalised IMF based on our detections (blue lines and shaded region) and the Slit members (black lines and shaded region). The plot shows the slope of different estimation of the IMFs of several populations in the Milky Way disc as a function of the stellar mass from the literature. The shadowed region corresponds to the propagated errors in the estimation of the parameters of the mean-normalised IMF of the NYMGs.
Current usage metrics show cumulative count of Article Views (full-text article views including HTML views, PDF and ePub downloads, according to the available data) and Abstracts Views on Vision4Press platform.
Data correspond to usage on the plateform after 2015. The current usage metrics is available 48-96 hours after online publication and is updated daily on week days.
Initial download of the metrics may take a while.