Fig. 11
Download original image
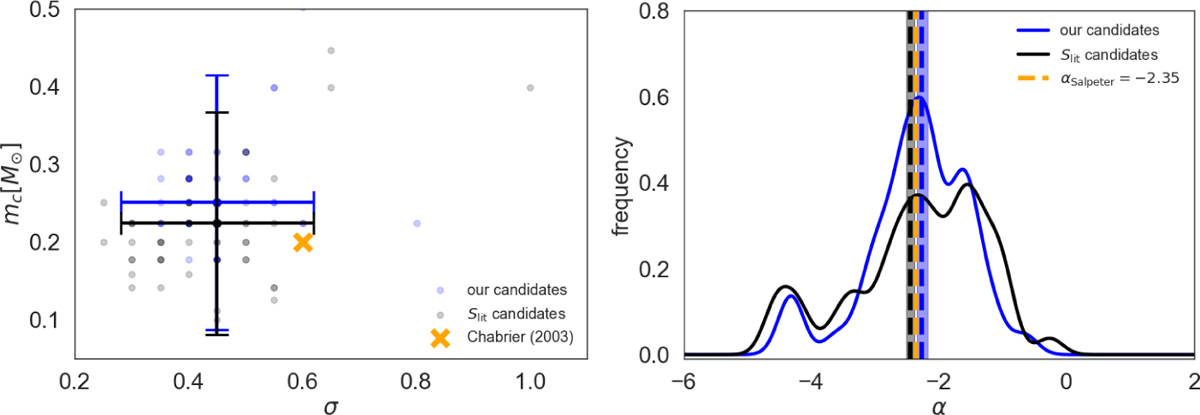
Estimated parameters of the inferred IMFs from our detections (blue) and the groups from Slit (black). The thick, non-transparent blue and black dots on the left panel and the dashed lines on the right panel indicate the values of the mean-normalised IMFs. The left plot shows the estimated values (transparent dots with error bars) for the parameters of the log-normal with the values from the parametrisation made by Chabrier (2005). The right plot shows the distribution of the power-law slopes estimated through a KDE with the value found by Salpeter (1955).
Current usage metrics show cumulative count of Article Views (full-text article views including HTML views, PDF and ePub downloads, according to the available data) and Abstracts Views on Vision4Press platform.
Data correspond to usage on the plateform after 2015. The current usage metrics is available 48-96 hours after online publication and is updated daily on week days.
Initial download of the metrics may take a while.