Fig. A.1
Download original image
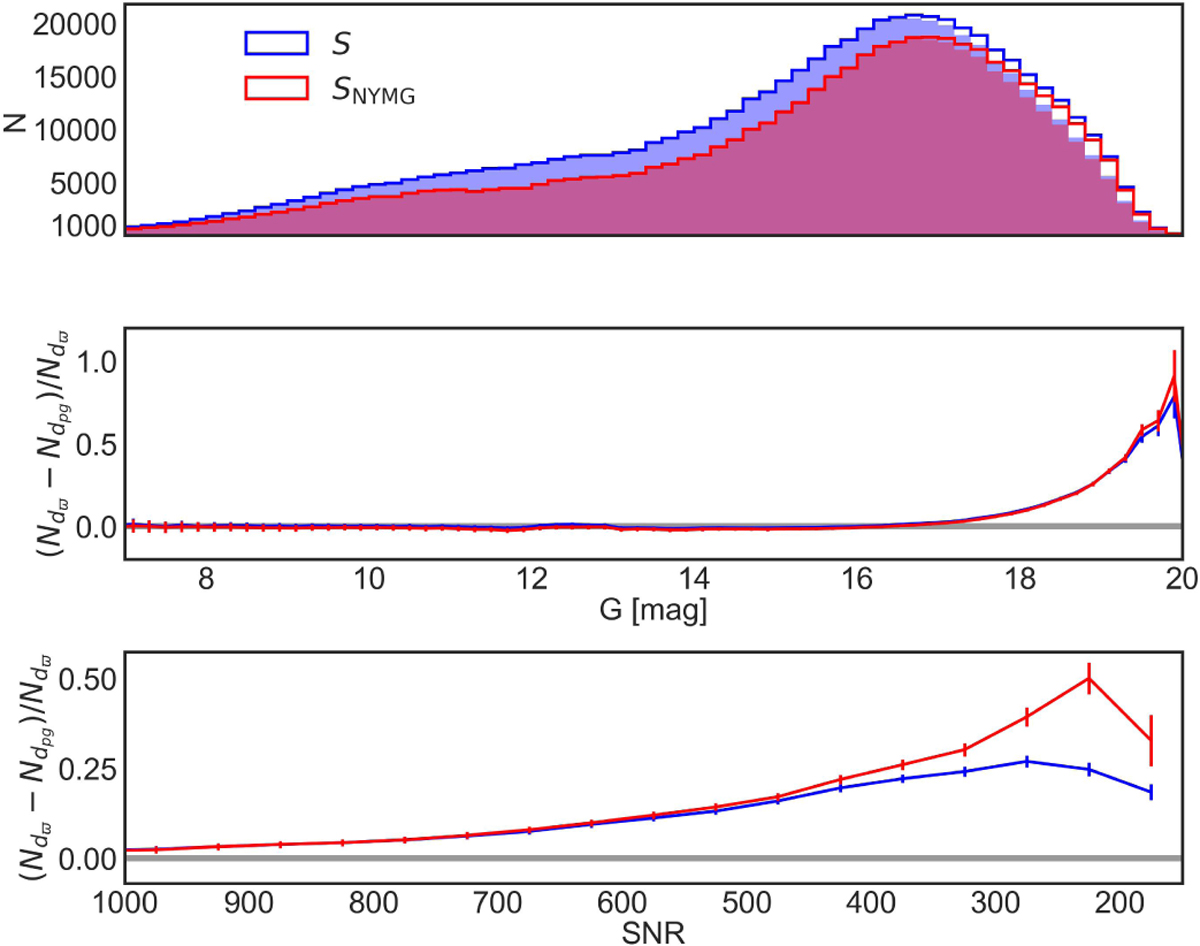
Top panel: Distribution of G magnitudes for the sample of stars with distances d = 1 /ϖ < 200 pc (solid line histograms) and distances dpg < 200 pc from Bailer-Jones et al. (2021) (shaded histograms). The blue histograms represent the S and Spg samples. The red histograms represent the SNYMG and SNYMGpg samples, as explained in Sect. 2.1. Middle panel: Residuals of the number of sources between SNYMG and S NYMGpg (red) and between S and Spg (blue) as a function of G. Bottom panel: Same residuals as the middle panel, shown as a function of the photometric S/N of G. All error bars correspond to the propagated Poisson error.
Current usage metrics show cumulative count of Article Views (full-text article views including HTML views, PDF and ePub downloads, according to the available data) and Abstracts Views on Vision4Press platform.
Data correspond to usage on the plateform after 2015. The current usage metrics is available 48-96 hours after online publication and is updated daily on week days.
Initial download of the metrics may take a while.