Fig. F.1
Download original image
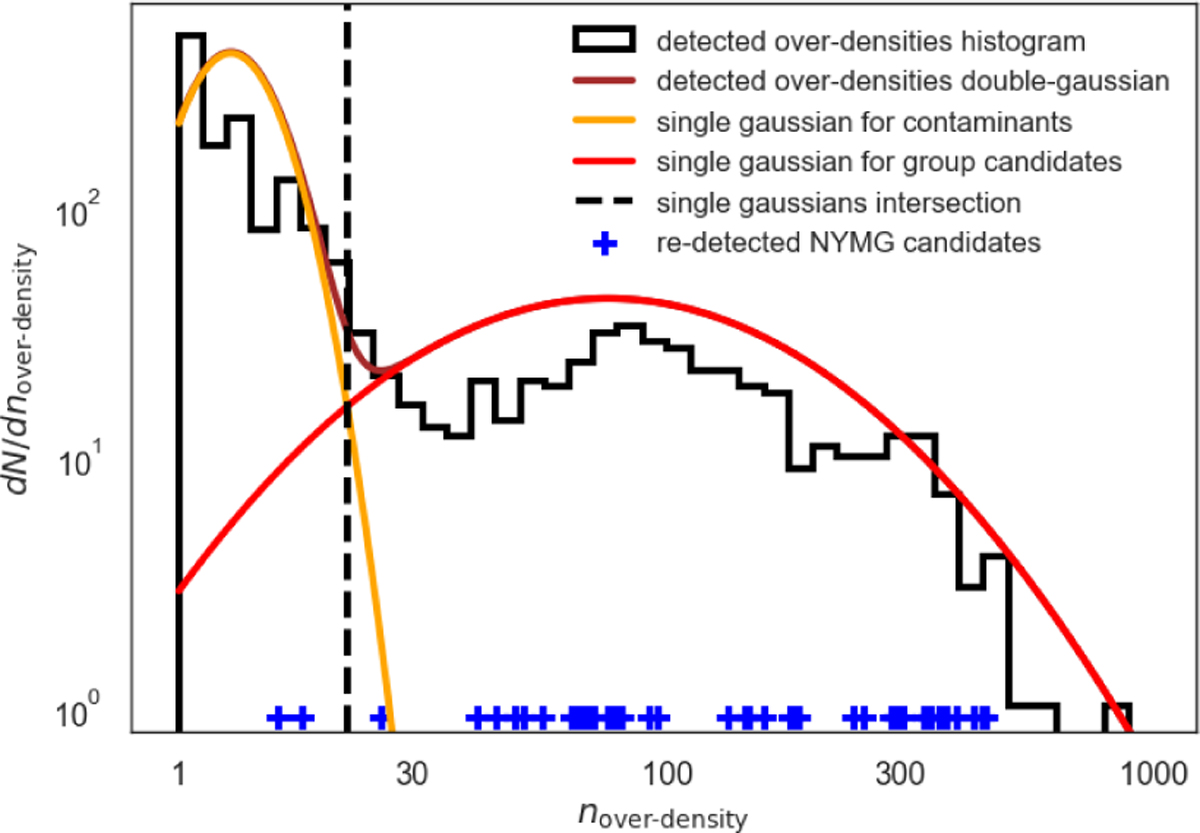
Uni-variate distribution of the over-density sizes (black histogram) with the double Gaussian fit (brown curve). The normal distributions of contaminants candidates and real over-density candidates are shown in orange and red respectively. The blue crosses indicate the number of members of the 33 detected group candidates associated with known NYMGs. The black dashed line shows where the two normal distributions intersect (Nover-densityy ~ 23).
Current usage metrics show cumulative count of Article Views (full-text article views including HTML views, PDF and ePub downloads, according to the available data) and Abstracts Views on Vision4Press platform.
Data correspond to usage on the plateform after 2015. The current usage metrics is available 48-96 hours after online publication and is updated daily on week days.
Initial download of the metrics may take a while.