Fig. 4
Download original image
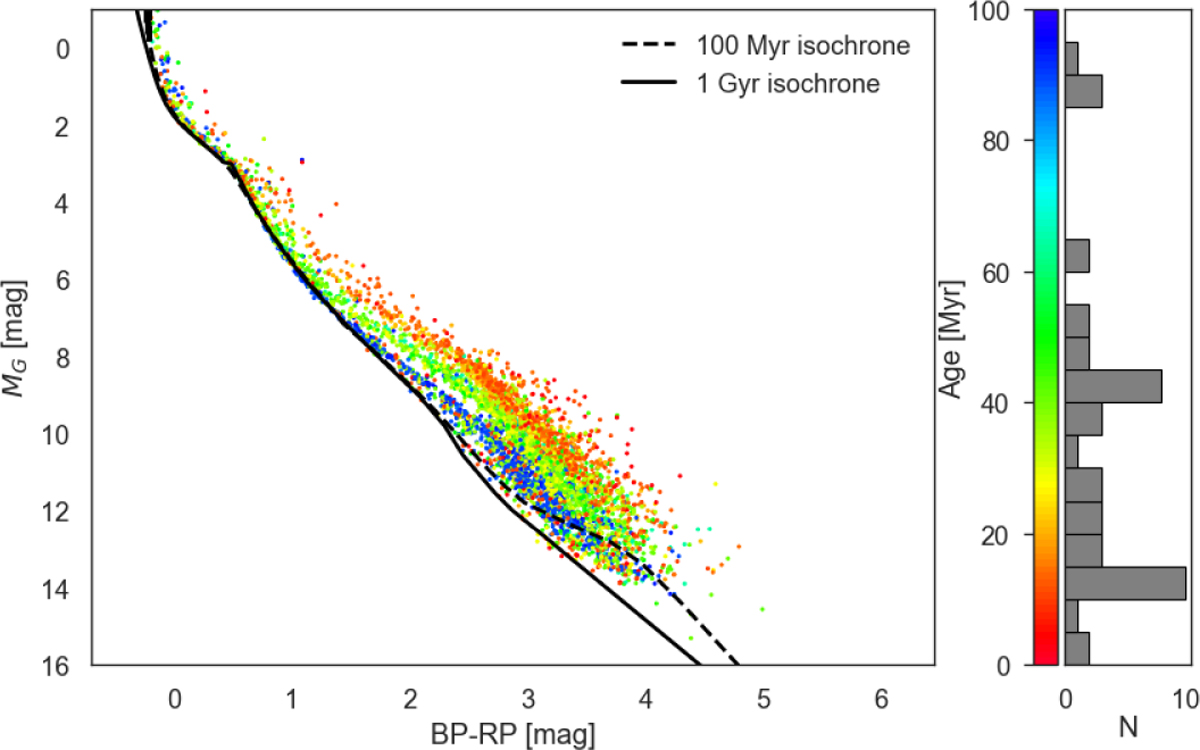
CMD distribution of all the 4166 candidate members detected in this work. The colour map shows the age of the identified groups according to MOCA. The black solid and dashed curve show the 1 Gyr and 100 Myr isochrones, respectively. The rotated histogram shows the distribution of the detected NYMG ages according to MOCA. The ageaxis of the histogram is the same as the colour bar axis.
Current usage metrics show cumulative count of Article Views (full-text article views including HTML views, PDF and ePub downloads, according to the available data) and Abstracts Views on Vision4Press platform.
Data correspond to usage on the plateform after 2015. The current usage metrics is available 48-96 hours after online publication and is updated daily on week days.
Initial download of the metrics may take a while.