Fig. 5
Download original image
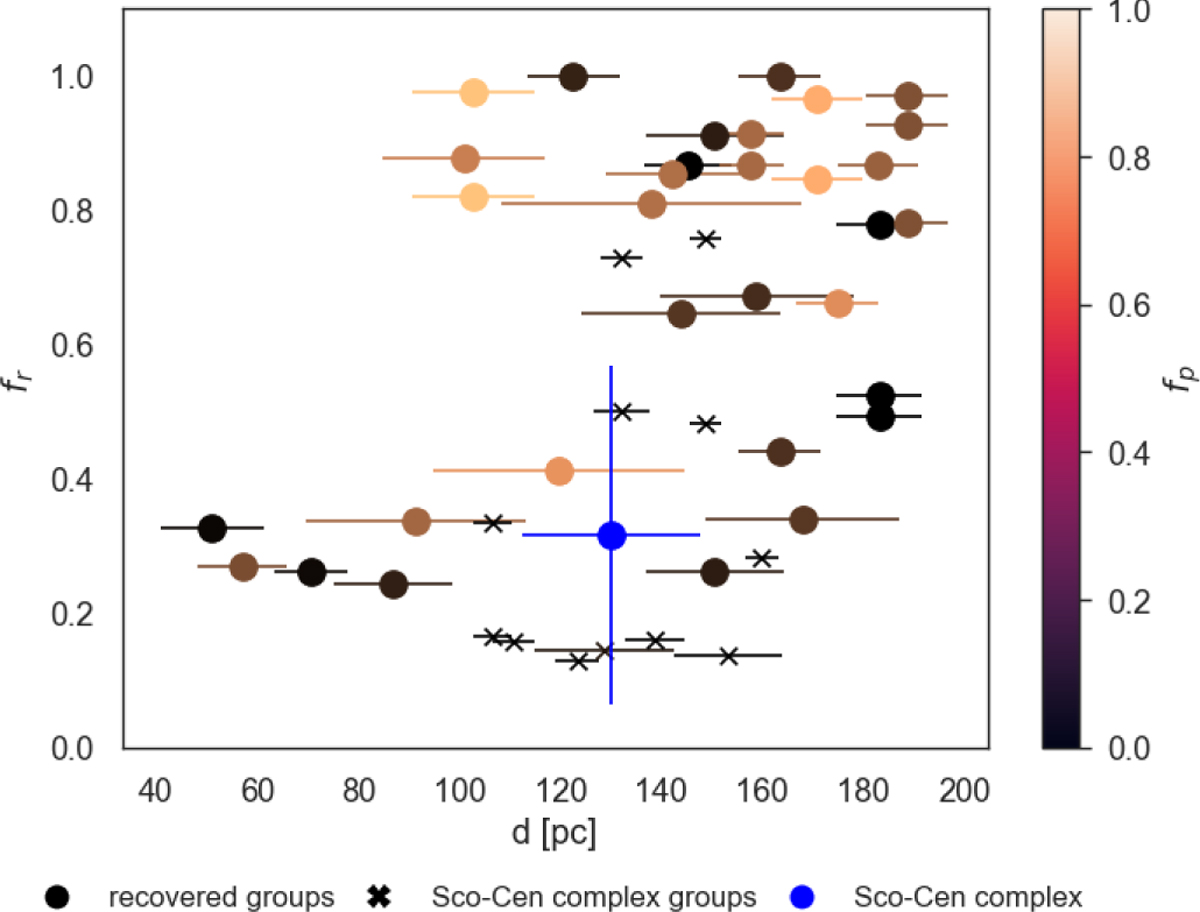
Recovery rates, fr, as a function of the mean distance of each detected group. The colour indicates the purity rate, fp. The dots correspond to all the recovered groups that are not part of the Sco-Cen complex while the crosses correspond to the ones that do belong. The blue dot indicates the mean recovery of the Sco-Cen complex groups.
Current usage metrics show cumulative count of Article Views (full-text article views including HTML views, PDF and ePub downloads, according to the available data) and Abstracts Views on Vision4Press platform.
Data correspond to usage on the plateform after 2015. The current usage metrics is available 48-96 hours after online publication and is updated daily on week days.
Initial download of the metrics may take a while.