Fig. 6
Download original image
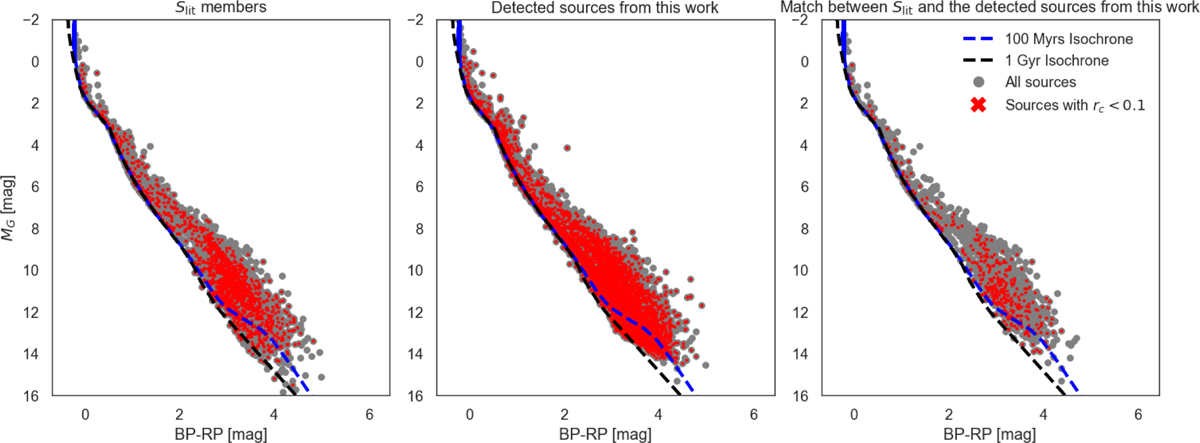
MG vs BP-RP CMD of the candidate members of the NYMG candidates before applying the rc > 0.1 cut (grey dots), highlighting the sources that are discarded with this cut (red crosses). The dashed lines indicate the 100 Myr (blue line) and 1 Gyr (black line) isochrones. Top, middle, and bottom plots correspond, respectively, to the members according to the candidates of S lit, the candidates of the detected groups from this work, and the exact match between the two latter samples.
Current usage metrics show cumulative count of Article Views (full-text article views including HTML views, PDF and ePub downloads, according to the available data) and Abstracts Views on Vision4Press platform.
Data correspond to usage on the plateform after 2015. The current usage metrics is available 48-96 hours after online publication and is updated daily on week days.
Initial download of the metrics may take a while.