Open Access
Fig. 7
Download original image
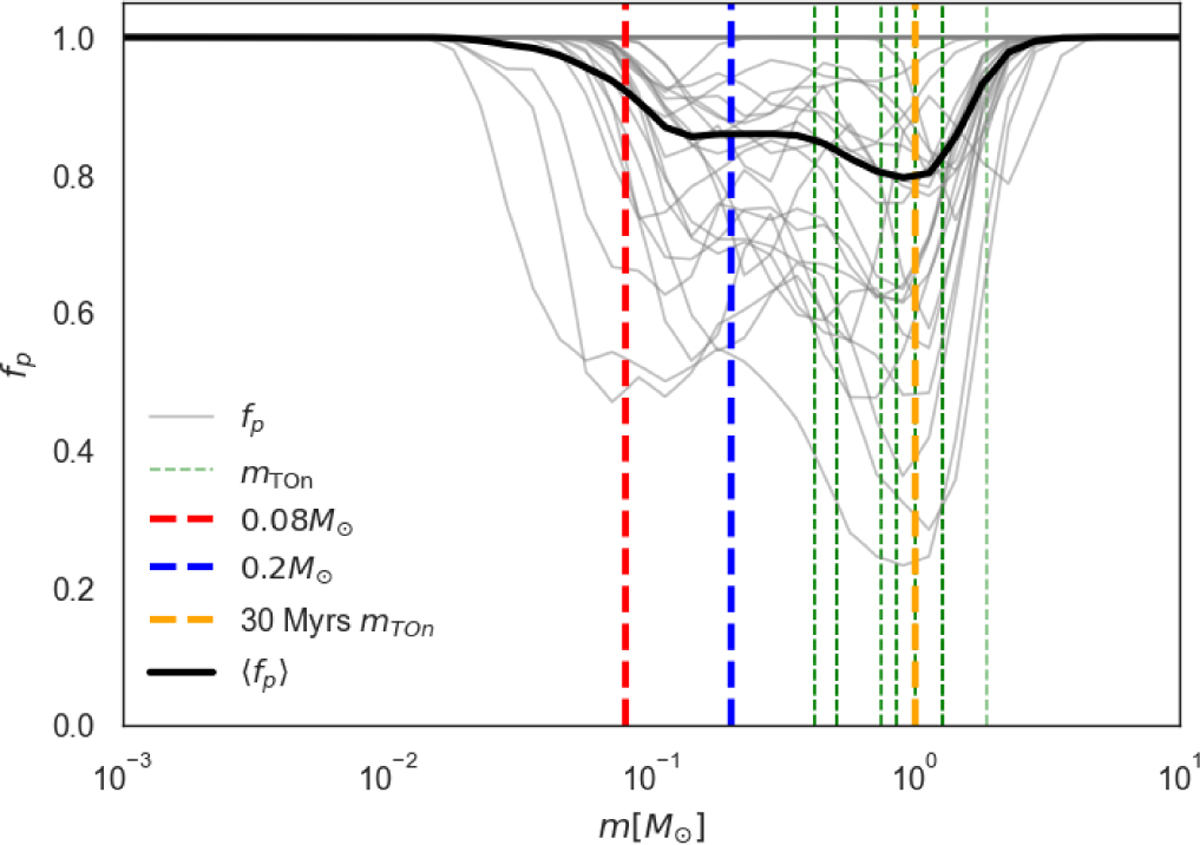
Purity functions, fp(m), estimated from the simulated fields for all the detected NYMGs (grey curves) and the mean purity, (fp(m)) (black curve). The red, blue, and green vertical dashed lines indicate respectively the 0.08 M⊙, 0.2 M⊙, and the masses of the TO of the different ages used to photometrically select the NYMGs.
Current usage metrics show cumulative count of Article Views (full-text article views including HTML views, PDF and ePub downloads, according to the available data) and Abstracts Views on Vision4Press platform.
Data correspond to usage on the plateform after 2015. The current usage metrics is available 48-96 hours after online publication and is updated daily on week days.
Initial download of the metrics may take a while.