Fig. 8
Download original image
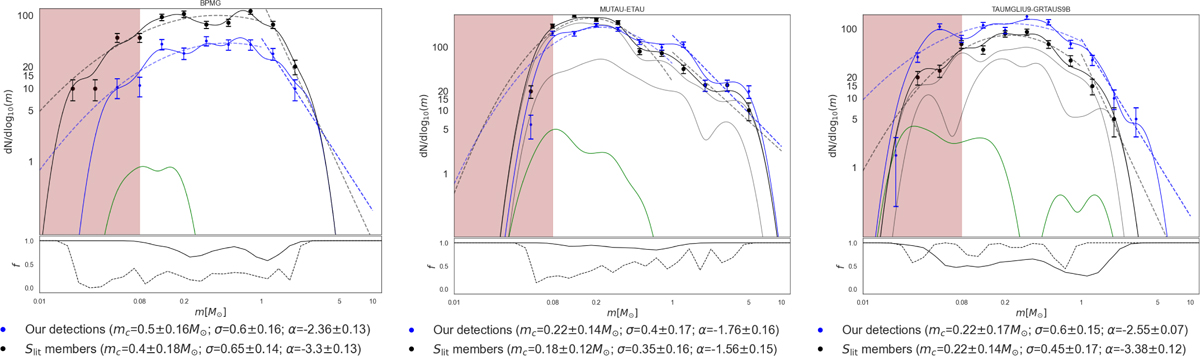
Characteristic inferred IMFs which illustrate the different cases found among the 33 groups: β-Pictoris (left panel), EMUTAU (middle panel), and TAUMGLIU-GRTAUS (right panel). Solid and dashed lines in the bottom panels show respectively the purity and recovery functions. The dots with error bars correspond to the histogram of the distributions with Poisson error bars using log10(0.1 M⊙) bins. The smooth solid curves correspond to the KDEs of the masses using a Gaussian Kernel and bandwidth of log10(0.1 M⊙). The areas of both the histogram and the KDE are normalised to the total number of members of the group. The green solid line correspond to the IMF of the synthetic sources of Sc detected as members of the groups. The grey solid curves correspond to the IMFs of the individual MOCA groups for the cases of EMUTAU and TAUMGLIU-GRTAUS. The dashed lines in the top panels represent the log-normal and power-law parametrisation of the KDE. Black and blue colours correspond to the results based on the members from Slit and our detections respectively. The brown region represents the mass range of brown dwarfs (m ≲ 0.08 M⊙).The value of the fitted parameters are indicated in the legend. In the cases where more than one NYMG from MOCA was detected, we show their individual IMFs in grey, while the total IMF is in black.
Current usage metrics show cumulative count of Article Views (full-text article views including HTML views, PDF and ePub downloads, according to the available data) and Abstracts Views on Vision4Press platform.
Data correspond to usage on the plateform after 2015. The current usage metrics is available 48-96 hours after online publication and is updated daily on week days.
Initial download of the metrics may take a while.