Fig. 9
Download original image
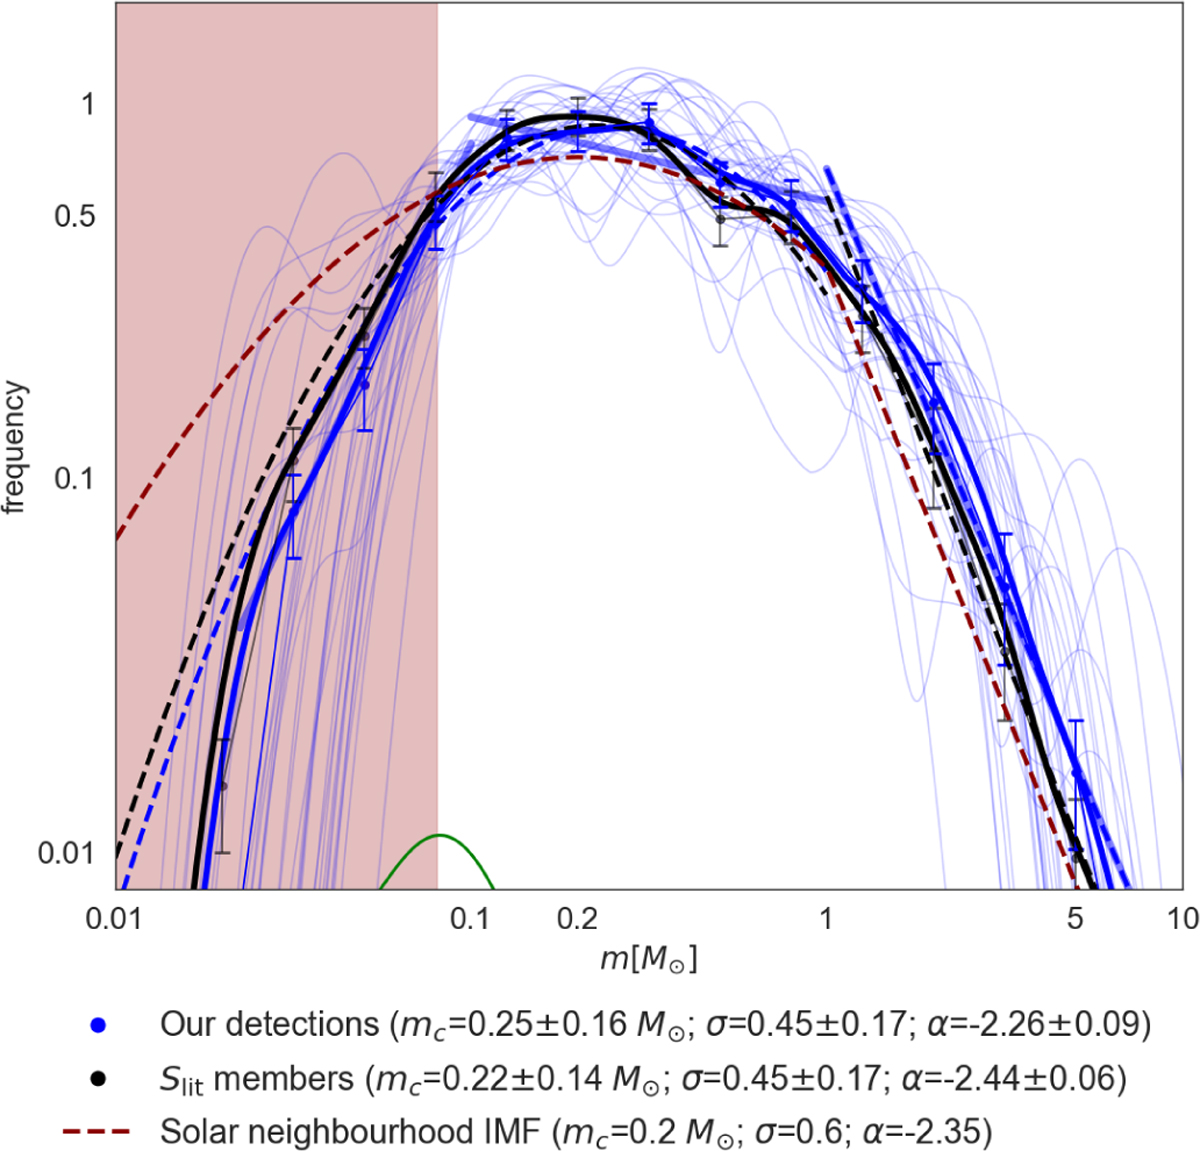
Normalised individual IMF KDEs of the 33 groups (blue transparent curves), the mean-normalised IMF from our detections (blue solid curve), and from the Slit groups (black). The dots with Poisson error bars show the mean-normalised histogram of the masses of the groups and the dashed curves show the log-normal and power-law parametrisations of the mean-normalised IMFs. The green curve shows the mean-normalised IMF of the synthetic sources. The thick blue transparent lines show the triple power law fitted to the mean-normalised IMF of our detections. The brown dashed line shows the typical IMF of the solar neighbourhood: Chabrier (2005) log-normal for m < 1 M⊙ and Salpeter (1955) power-law for higher masses.
Current usage metrics show cumulative count of Article Views (full-text article views including HTML views, PDF and ePub downloads, according to the available data) and Abstracts Views on Vision4Press platform.
Data correspond to usage on the plateform after 2015. The current usage metrics is available 48-96 hours after online publication and is updated daily on week days.
Initial download of the metrics may take a while.