Fig. 2
Download original image
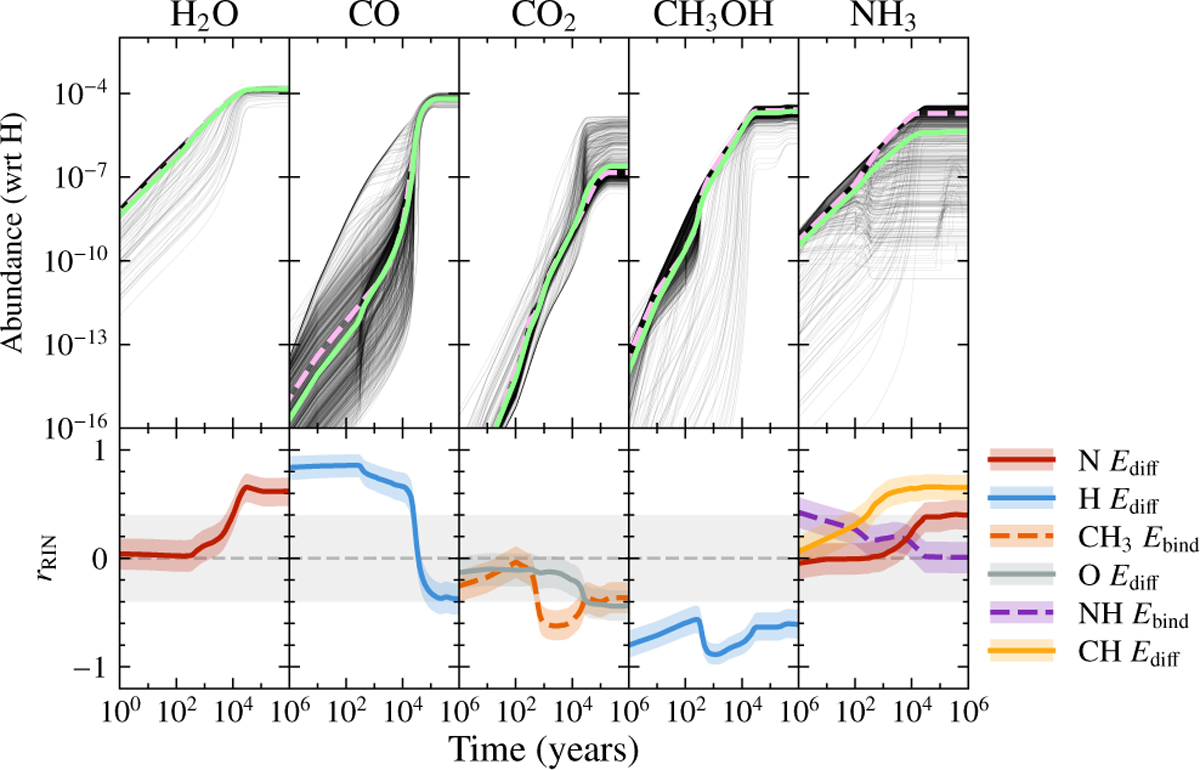
Abundances (top) and correlation coefficients (bottom) of H2O, CO, CO2, CH3OH, and NH3 ices at T=10 K, nH=105 cm−3, ζ= 1.3 × 10⁻¹⁷ s−1 and FUV=1 Habing. In the top panels, the dashed pink line indicates the abundance using the nominal network, black lines indicate the individual samples, and light green is the log-average of all samples. In bottom subplots, the dashed gray line indicates perfectly uncorrelated parameters (rRIN=0), and the filled gray area indicates “weakly” correlated parameters (|rRIN|<0.4). The colored filled areas correspond to the 95% confidence intervals of the correlation coefficients.
Current usage metrics show cumulative count of Article Views (full-text article views including HTML views, PDF and ePub downloads, according to the available data) and Abstracts Views on Vision4Press platform.
Data correspond to usage on the plateform after 2015. The current usage metrics is available 48-96 hours after online publication and is updated daily on week days.
Initial download of the metrics may take a while.