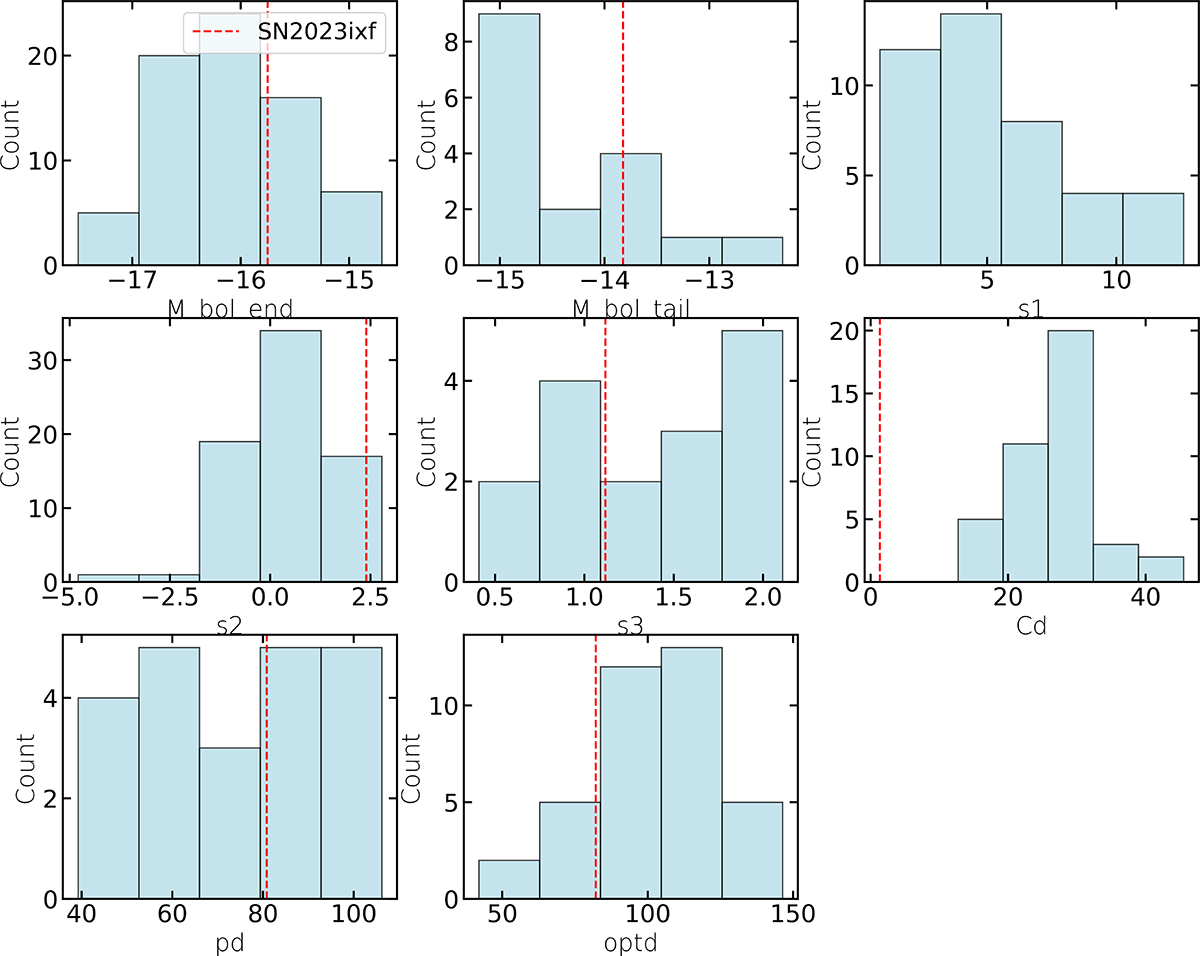
Fig. 10.
Download original image
Comparison of SN2023ixf bolometric light curve with Type-II population from Carnegie Supernova project (Martinez et al. 2022). The features are those reported in Martinez et al. (2022): M_bol_end is the bolometric magnitude measured 30 d before tPT (midpoint of the plateau–tail transition). If tPT is not defined, this is the magnitude of the last observation during the optically thick phase; M_bol_tail is the bolometric magnitude 30 d after tPT. If the transition is not well defined but the tail is observed, this is the magnitude at the closest point after the transition; s1 is the decline rate (mag/100 d) of the early cooling phase, obtained from a linear fit; s2 is the decline rate of the plateau phase, obtained from a linear fit; s3 is the decline rate of the radioactive tail, obtained from a linear fit with at least three data points; Cd is the cooling phase duration, from texplosion to ttrans; pd is the plateau duration, tPT − ttrans; optd is the optically thick phase duration, tPT (if texplosion is known). When possible, we estimated the parameters following the formalism in Martinez et al. (2022). The values are within the distributions for each of the parameters; the only value we could not estimate is s1, due to the lack of data in the time range defined to infer this parameter.
Current usage metrics show cumulative count of Article Views (full-text article views including HTML views, PDF and ePub downloads, according to the available data) and Abstracts Views on Vision4Press platform.
Data correspond to usage on the plateform after 2015. The current usage metrics is available 48-96 hours after online publication and is updated daily on week days.
Initial download of the metrics may take a while.