| Issue |
A&A
Volume 706, February 2026
|
|
|---|---|---|
| Article Number | A320 | |
| Number of page(s) | 13 | |
| Section | Stellar structure and evolution | |
| DOI | https://doi.org/10.1051/0004-6361/202557952 | |
| Published online | 17 February 2026 | |
Unveiling the progenitor of SN 2023ixf: Circumstellar dust and its implications for the red supergiant problem
1
Università di Napoli Federico II, Dipartimento di Fisica “Ettore Pancini” Via Cinthia 9 I-80126 Naples, Italy
2
INAF – Osservatorio Astronomico di Capodimonte Via Moiariello 16 I-80131 Naples, Italy
3
INAF – Osservatorio Astronomico di Roma Via di Frascati 33 I-00078 Monteporzio Catone, Italy
4
Università Tor Vergata, Dipartimento di Fisica Via della Ricerca Scientifica 1 I-00133 Rome, Italy
5
Institute of Space Sciences (ICE, CSIC), Campus UAB Carrer de Can Magrans s/n E-08193 Barcelona, Spain
6
Institut d’Estudis Espacials de Catalunya (IEEC) E-08860 Castelldefels (Barcelona), Spain
7
INAF–Osservatorio Astronomico di Brera Via Bianchi 46 I-23807 Merate (LC), Italy
8
Università La Sapienza, Dipartimento di Fisica Piazzale Aldo Moro 2 I-00185 Rome, Italy
9
INFN, Sezione di Roma, I-00133 Piazzale Aldo Moro 2 – 00185 Roma RM, Italy
10
Fundación Galileo Galilei – INAF, Rambla J.A.Fernández P. 7 38712 B.Baja (S.C.Tenerife), Spain
11
Dipartimento di Fisica e Astronomia, Sezione Astrofisica, Università di Catania Via S. Sofia 78 I-95123 Catania, Italy
★ Corresponding author: This email address is being protected from spambots. You need JavaScript enabled to view it.
Received:
3
November
2025
Accepted:
6
January
2026
Abstract
The nearby Type II supernova SN 2023ixf offers a critical test of the long-standing ‘red supergiant problem’ – the apparent absence of high-mass red-supergiant progenitors in pre-explosion imaging. We present new late-time observations of SN 2023ixf: SiFAP2 photometry (714–772 d) with a custom supernova calibration, Swift-UVOT detections (788–801 d), and the one of the latest spectroscopic observations beyond 100 days (DOLoRES at 772 d). Combining these with archival data, we obtain two discrepant progenitor-mass estimates: light-curve modelling yields 5.5–14 M⊙, while nebular oxygen mass (∼2.3 M⊙) and other spectroscopic diagnostics point to 17–19 M⊙. We reconcile this tension with a Bayesian Monte-Carlo framework that includes anisotropic circumstellar dust. Our analysis demonstrates that even a modest, clumpy circumstellar medium can produce sufficient extinction to bias luminosity-based masses downwards by ∼9 M⊙. Late-time photometry and spectroscopy further reveal clear signatures of shock interaction with circumstellar material (CSM) shells ejected centuries before explosion. SN 2023ixf thus provides direct evidence that circumstellar obscuration is a major contributor to the apparent lack of massive red-supergiant progenitors, underscoring the need for multi-method, multi-epoch observations for robust progenitor-mass determination.
Key words: stars: massive / stars: mass-loss / supernovae: general
© The Authors 2026
 Open Access article, published by EDP Sciences, under the terms of the Creative Commons Attribution License (https://creativecommons.org/licenses/by/4.0), which permits unrestricted use, distribution, and reproduction in any medium, provided the original work is properly cited.
This article is published in open access under the Subscribe to Open model. This email address is being protected from spambots. You need JavaScript enabled to view it. to support open access publication.
1. Introduction
SN 2023ixf was discovered on 19 May 2023 at 17:27:15 UTC in the nearby galaxy M101 (z = 0.000804), at RA(J2000) = 14:03:38.580, Dec(J2000) = +54:18:42.10 (Itagaki 2023; Perley et al. 2023). It was immediately classified as a Type II core-collapse supernova (CCSN) based on flash ionisation lines of H, He, C, and N (Perley & Gal-Yam 2023). The event quickly became one of the most intensively followed astrophysical transients, with extensive multi-wavelength coverage spanning optical, IR, UV, radio, X-ray, gamma-ray, neutrino, and gravitational-wave facilities (see, e.g. Jacobson-Galán et al. 2023; Hiramatsu et al. 2023; Matthews et al. 2023; Grefenstette et al. 2023; Martí-Devesa et al. 2024; Guetta et al. 2023; Abac et al. 2025). Progenitor studies (e.g. Moriya & Singh 2024; Rest et al. 2025), whether based on pre-explosion imaging or modelling, consistently point to a red supergiant (RSG) origin, but estimates of its initial mass (ranging from 8–10, 12–17, to > 18 M⊙) and radius (500–800 R⊙, up to > 950 R⊙) remain discrepant (Rest et al. 2025).
Panjkov et al. (2024) analysed 18 years of pre-explosion X-ray non-detections (primarily with Chandra) and applied formalisms that link X-ray luminosity limits to mass-loss rates via circumstellar wind density (Margutti et al. 2012; Matsumoto & Metzger 2022). From early Swift observations, they inferred that the absence of soft X-rays up to 3.3 days post-explosion implies a relatively low-density wind, corresponding to a mass-loss rate of ≈10−4 M⊙ yr−1 derived using the relation of Fransson et al. (1996). These findings suggest that any enhanced mass-loss episode likely occurred at least 0.5–1.5 years before the explosion. The same authors also analysed post-explosion X-ray spectra and found that single-component models cannot reproduce the observed soft excess below 2 keV. Instead, they favour a two-component absorbed bremsstrahlung model consisting of a hot, heavily absorbed component (kT ≈ 35 keV, NH ≈4 × 1022 cm−2) associated with the forward shock, and a cooler, less absorbed component (kT ≈ 0.3 keV, NH ≈ 1022 cm−2) attributed to emission from the cooling shock front. This indicates that the circumstellar material (CSM) interaction involves regions of different density and absorption. However, detailed time-resolved joint X-ray spectral modelling by Nayana et al. (2025) over 4–86 days post-explosion disfavours a two-temperature interpretation, and instead suggests a single evolving thermal component, underscoring the complexity of the shock interaction and the need for multi-epoch analysis.
SN 2023ixf provides a unique opportunity to study the long-standing ‘red supergiant problem’ – the apparent lack of detected progenitors with MZAMS ≳ 17 M⊙ (Davies & Beasor 2020). Systematic biases from circumstellar dust, uncertain bolometric corrections, mid-IR variability, and line-of-sight obscuration can substantially lower inferred progenitor masses (Walmswell & Eldridge 2012; Davies & Beasor 2020; Beasor & Davies 2017). The proximity of SN 2023ixf, its dense observational coverage, and pre-explosion imaging constraints allow a direct test of this mass cutoff: Rest et al. (2025) excluded progenitors with MZAMS ≥ 22 M⊙, consistent with earlier limits that may reflect either a selection effect or an intrinsic constraint on the progenitor mass distribution. Mid-IR variability indicates a dust-enshrouded RSG (Kilpatrick et al. 2023; Soraisam et al. 2023), while hydrodynamical and nebular modelling favour a progenitor mass of 10–15 M⊙ (Bersten et al. 2024; Ferrari et al. 2024). Together, these studies highlight how observational biases complicate progenitor mass estimates, suggesting that the observed cutoff may stem from systematic effects rather than strict physical limits.
This work makes multiple novel contributions: (1) the first late-time (≥700 d) spectrum of SN 2023ixf, which reveals shock-accelerated CSM; (2) new photometry and spectroscopic observations; (3) a reconstruction of the mass-loss history from days to centuries before explosion; and (4) a quantification of how CSM dust biases progenitor mass estimates. We combine these to provide the most complete picture yet of SN 2023ixf’s progenitor system.
The paper is organised as follows. Section 2 describes our new late-time observations and the archival data used. Sections 3 and 4 present the analysis of the light curves and spectra, respectively. The implications of our results for the RSG problem are discussed in Section 5, and we summarise our conclusions in Section 6.
2. New observations of SN 2023ixf
We present new late-time observations of SN 2023ixf obtained approximately 800 days post-explosion using three facilities: the Silicon Fast Photometer and Polarimeter (SiFAP2) and the Device Optimized for the LOw RESolution (DOLoRES) spectrometer at the Telescopio Nazionale Galileo (TNG), and the Neil Gehrels Swift Observatory. All phases in this work are expressed relative to the explosion epoch t0 = 60082.75 MJD (2023-05-18 17:58:52.800 UTC) unless otherwise noted.
2.1. SiFAP2 photometry
This research represents the first application of SiFAP2 to supernova photometry and required the development of a custom colour correction as described below. The SiFAP2 instrument (Ghedina et al. 2018) is a high-time-resolution photon counter (optical photometer and polarimeter) mounted at the TNG in La Palma, Canary Islands, Spain. We observed SN 2023ixf over six non-consecutive nights under Director’s Discretionary Time (project ID A51DDT3; PI: A. Simongini). Observations were obtained in white light (300–900 nm effective band) with 1 s sampling and continuous 9000 s integrations.
As reported in Table 1, the first three epochs (MJD 60085, 60116, 60185; 2.25, 33.25, and 102.25 days post-explosion) sample the rise, peak, and early decline of the light curve, while the last three (MJD 60797, 60798, 60855; 714.25, 715.25, and 772.28 days post-explosion) probe the late, post-radioactive-decay phases. These represent the first SiFAP2 observations of SN 2023ixf.
New SiFAP2 and Swift-UVOT observations of SN 2023ixf.
For each night, we collected photon arrival times over an hour-long baseline while the telescope tracked the target. The spectral distribution of detected photons showed no statistically significant colour evolution within each session, which enabled the integration of counts to obtain a nightly average instrumental magnitude, minst.
Although Ghedina et al. (2018) provide a calibration converting SiFAP2 counts to V-band magnitudes under a blackbody assumption, this is inadequate for supernovae due to strong line features and rapid colour changes. We therefore derived an empirical colour correction, Δcolour(t), based on near-simultaneous multi-band photometry of SN 2023ixf. Calibrated V-band magnitudes were computed as
 (1)
(1)
The correction was validated against independent V-band photometry at similar epochs. Uncertainties include photon-counting errors and propagation from the colour correction.
2.2. Swift-UVOT and XRT observations
We obtained Swift observations of SN 2023ixf on MJD 60870, 60877, and 60884 (787.83, 794.75, and 801.36 days post-explosion) via target of opportunity programmes (IDs 22872, 22946; PI: A. Simongini). Total exposures were 1215 s, 1665 s, and 2205 s, respectively (Fig. 1).
 |
Fig. 1. Detection of SN 2023ixf on MJD 60884.11 (801.36 days post-explosion) with Swift-UVOT in the V band. |
UltraViolet and Optical Telescope (UVOT) data were taken in Image mode: mode 0x209a (simultaneous U, B, V) for the first two epochs and mode 0x2005 (V only) for the last. Reduction used DRESSCode within HEASoft (Decleir et al. 2019), with photometry from SExtractor (Bertin & Arnouts 1996). No detection was achieved in the first epoch. In the second epoch, we measured B = 21.71 ± 0.14, U = 21.86 ± 0.08, V = 20.95 ± 0.08. A clear detection in the third epoch gave V = 20.33 ± 0.01 (Table 1).
X-Ray Telescope (XRT) data were collected in photon-counting mode (0.3–10 keV). No significant X-ray excess was found at the supernova (SN) position. Data were reduced with xrtpipeline, and count rates were estimated with sosta using a ten-pixel background region. Fluxes were derived via WebPIMMS assuming a power-law index of 2 and Galactic nH = 7.43 × 1020 cm−2. Assuming isotropic emission, we placed 3σ upper limits on the unabsorbed luminosity (Table 2). Combining all epochs under the assumption of no spectral variation gives a limit of L0.3-10 keV < 6.73 × 1038 erg s−1.
Swift-XRT observations of SN 2023ixf.
2.3. DOLoRES spectroscopy
We obtained one late-time spectrum of SN 2023ixf with the DOLoRES spectrograph at the TNG on MJD 60854 (772.28 days post-explosion). The LR-R grism was used, providing a resolution of R ≈ 700 over 5000–9500 Å, with a total exposure time of 3 × 2700 s. Data reduction followed the standard TNG pipeline, including bias subtraction, flat-fielding, wavelength calibration, and flux calibration using spectrophotometric standards. This spectrum provides one of the latest spectroscopic coverages of SN 2023ixf beyond ∼100 days post-explosion and is used here to analyse late-time Hα emission and CSM interaction signatures (Section 5).
3. Archival data
3.1. Photometry
We collected archival optical and near-infrared light curves of SN 2023ixf from WISeREP (Yaron & Gal-Yam 2012) and AAVSO (Kafka et al. 2018), supplemented by UV to near-IR data from Li et al. (2024) and Zimmerman et al. (2024), and IR (J, H, Ks) data from Mayya et al. (2023). The combined dataset covers MJD 60082 to 60280 (0–198 days post-explosion). We applied Gaussian process (GP) interpolation to obtain smoothly sampled light curves, from which we derived an explosion epoch of t0 = 60082.75 ± 0.16 MJD.
3.2. Spectroscopy
We compiled archival spectroscopic data from recent literature on SN 2023ixf (Martinez et al. 2024; Zimmerman et al. 2024; Ferrari et al. 2024; Bostroem et al. 2024; Fang et al. 2025). Most spectra were retrieved from WISeREP (Yaron & Gal-Yam 2012), with later epochs from AAVSO (Kafka et al. 2018). Although these spectra are not new, all spectral measurements (line fluxes, equivalent widths, velocities) presented here were independently recalculated from the original data to ensure homogeneous analysis. The archival spectra cover ∼3000–10 000 Å and phases from −7.8 to +111.4 days relative to the V-band maximum (−5 to +113 days post-explosion). These are complemented by our new DOLoRES spectrum at 772.28 days.
4. Light-curve analysis
SN 2023ixf was monitored for almost 800 days post-explosion, with a mean cadence of ≈2 d for the first 400 d across all bands, allowing the light curve to be densely sampled through the radioactive tail. After ∼500 days, the cadence became more sporadic, with a gap of ≈100 days between late-time observations (Table 3).
Summary of spectroscopic data used in this work.
We analysed the light curves using CASTOR (see Simongini et al. 2024, 2025), a code that applies GP interpolation to derive key parameters and compares them with a sample of 150 SNe. This provides independent estimates of progenitor and explosion parameters, in line with previous studies (e.g. Jacobson-Galán et al. 2023; Nayana et al. 2025). From this analysis, we find that SN 2023ixf follows an evolution similar to SN 2013ej (Valenti et al. 2014; Bose et al. 2015), SN 2014G (Terreran et al. 2016), SN 2024bch (Andrews et al. 2025), and SN 2013by (Valenti et al. 2015; Black et al. 2017). Figure 2 compares their absolute magnitudes.
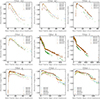 |
Fig. 2. Comparison between SN 2023ixf (brown), SN 2013by (blue), SN 2013ej (green), SN 2014G (red), and SN 2024bch (gold) light curves. We only show the filters for which data are available for all the aforementioned supernovae: (top row) m2, w1, w2; (middle row) U, B, V; (bottom row) g, r, i. The SN 2023ixf data points are interpolated with GPs. The SN 2023ixf observation in the V-band at ∼800 days post-explosion is not used for comparison. The red line is the GP regression model for the SN data in the selected band. |
We adopt a total extinction correction consisting of Milky Way and host galaxy contributions: AMW = 0.025 (Schlegel et al. 1998; Schlafly & Finkbeiner 2011) and Ahg = 0.1023 (Jacobson-Galán et al. 2023). The distance is taken as the average of available estimates from the NASA Extragalactic Database (NED), giving d = 6.644 ± 0.087 Mpc. The corresponding distance modulus is μ = 29.11 ± 0.03. These values are used throughout the paper.
Figure 2 shows that SN 2023ixf is brighter than the comparison templates in most filters, reaching a V-band peak magnitude of −18.21 ± 0.14, comparable to SN 2013by. The Swift/UVOT filters (U, B, V, M2, W1, W2) display a steep rise and rapid decline over ∼40 days, similar to SN 2013ej, SN 2014G, and SN 2024bch.
The post-peak V-band decline rate of SN 2023ixf is 0.024 ± 0.001 mag per 50 days during the first 90 days after maximum. This early decline is governed primarily by hydrogen recombination in the expanding envelope; a faster decline corresponds to a less massive or more diffuse hydrogen envelope, whereas a slower decline indicates a more massive or denser envelope that recombines more gradually. The comparison also shows that SN 2023ixf evolves in a similar way to other Type II SNe up to ∼150 days, consistent with 56Ni-powered decay. However, as shown in Figure 3, at ∼700 days post-explosion the source remains unexpectedly bright.
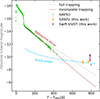 |
Fig. 3. V-band light-curve evolution of SN 2023ixf. Between 100 and 450 days post-explosion, the decline is well described by a radioactive decay model, tested under both full and incomplete γ-ray trapping scenarios. At later epochs, however, the SiFAP2 and Swift-UVOT measurements (700–800 days post-explosion) lie significantly above the radioactive-decay fits. These very late-time data are instead reproduced by a shock-powered model of the form |
The late-time detections (700–800 days) lie above both full and incomplete γ-ray trapping models. The incomplete trapping model, which fits the data up to 450 days post-explosion (MNi = 0.04 M⊙, tγ ≈ 300 days), predicts mV = 22.24 mag at 714 days, about 2.3 mag fainter than our SiFAP2 measurement, implying a factor of ∼8× re-brightening. These late-time points instead follow  , consistent with earlier multi-band modelling (Jacobson-Galán et al. 2025). From the fit we derive a pre-explosion wind speed of vw = 50 km s−1 and a mass-loss rate of Ṁ = 1.18 × 10⁻⁴ M⊙ yr−1.
Late-time interaction between the SN ejecta and the CSM can produce thermal bremsstrahlung emission detectable in X-rays. Assuming a steady wind, the X-ray luminosity can be related to CSM parameters (Chevalier & Fransson 2003; Dwarkadas 2025). If the interaction began around +450 days post-explosion, the CSM shell is located at ∼2.76 × 1016 cm, which implies a mass ejection ∼175 years before explosion. The corresponding ejecta velocity is vej ∼ 7000 km s−1.
4.1. Bolometric light curve
We constructed the bolometric light curve using SuperBol (Nicholl 2018), which combines multi-band photometry from different filters and instruments to reconstruct the spectral energy distribution (SED) at each epoch. The code corrects observed magnitudes for Galactic and host extinction using the reddening values quoted above, converts them to flux densities, and interpolates the SED across the observed wavelength range.
The results are shown in Figure 4. During the first 100 days post-explosion, the photospheric temperature rises quickly to Tbb = 21 500 ± 9660 K, while the radius grows nearly linearly.
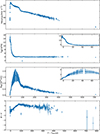 |
Fig. 4. Evolution of the bolometric light curve, the black-body temperature, the photometric radius, and the colour evolution (from top to bottom). Except for the colour evolution, all trends are derived from SuperBol fits to the multi-band photometry. The insets zoom in on the first 70 days post-explosion. See Sect. 4.1 for details. |
The bolometric light curve rises steeply, peaking at Lbol = (2.98 ± 0.01)×1042 erg s−1 at tmax = 60086.85 ± 0.05 MJD, i.e., 4.1 days after explosion. It exhibits a plateau lasting ≈70 days, followed by a steep decay and a tail that can be described by three linear segments:
-
A decay rate of 0.013 ± 0.001 mag d−1 from MJD 60157 (74.3 days post-explosion),
-
A decay rate of 0.005 ± 0.001 mag d−1 from MJD 60220 (137.3 days post-explosion),
-
A decay rate of 0.004 ± 0.001 mag d−1 from MJD 60500 (417.3 days post-explosion).
The early evolution, through the end of the plateau, is mirrored in the photospheric temperature and colour evolution (second and fourth panels of Figure 4). Yoon et al. (2019) found a tight correlation between these trends and the 56Ni distribution in the ejecta. Delayed 56Ni heating can cause an initial phase of rapid reddening, followed by a change in the slope of the colour curves as seen in Figure 4. This slope reversal marks the end of the post-breakout plateau and the onset of a re-brightening phase. The colour evolution is consistent with the temperature evolution, where the photospheric temperature drops rapidly at first and then begins to rise again.
4.2. Bayesian modelling of circumstellar dust extinction
To quantify the impact of circumstellar dust on the inferred progenitor mass, we implemented a Bayesian Monte Carlo framework that models additional visual extinction (AV, CSM) produced by dust in the circumstellar medium. The model incorporates several uncertain parameters: the total CSM mass (MCSM), the dust-to-gas ratio (fdust), V-band dust opacity (κV), characteristic dust distance from the progenitor (rmean), and the exponent α in the mass–luminosity relation L ∝ Mα.
The correction to the initial mass is computed as
 (2)
(2)
where MZAMS, LC = 9 M⊙ is the initial mass inferred from the light curve with standard extinction correction. The additional extinction from CSM dust is estimated as
 (3)
(3)
where Σdust is the dust surface density.
We adopted uniform priors over physically plausible ranges: MCSM ∈ [0.001, 100] M⊙, fdust ∈ [0.005, 0.1], κV ∈ [100, 1000] cm2 g−1, rmean ∈ [1 × 10¹⁶, 5 × 10¹⁷] cm, and α ∈ [1.0, 6.0]. The likelihood is defined by comparing the corrected mass, Mcorr, to the spectroscopically derived mass, MZAMS, spec = 17.95 M⊙, assuming a Gaussian uncertainty corresponding to the spectroscopic error range.
We explored the posterior distribution using the emcee monte carlo markov chain (MCMC) sampler with 100 walkers and 10 000 steps per walker, discarding the first 1000 steps as burn-in. The resulting distribution of corrected masses has a median of 17.72 M⊙, with 16th and 84th percentiles of 16.45 and 18.97 M⊙, respectively. This corresponds to a median shift of 8.72 M⊙ relative to the light-curve estimate, with a 42.8% probability that Mcorr exceeds the spectroscopically derived value.
Notably, the posterior favours a total CSM mass of ∼56 M⊙, which is orders of magnitude higher than the ionised gas mass traced by Hα (∼0.001 M⊙). This discrepancy arises because the model assumes a smooth, spherically symmetric dust distribution, whereas the actual CSM is likely to be clumpy or anisotropic. In such geometry, modest total dust mass concentrated along particular lines of sight can produce significant extinction without requiring uniformly high gas densities. This interpretation is consistent with the asymmetric Hα profiles observed at late times and with the complex, stratified CSM inferred from early spectral features.
5. Spectroscopic analysis
We analysed the spectral evolution of SN 2023ixf from early flash-ionisation features to late-time nebular emission, combining archival data with our new DOLoRES spectrum at 772.28 days post-explosion. All spectra were analysed using the specutils1 package, with results available in an interactive plot at https://sn2023ixfireferenceplot.netlify.app.
5.1. Early-time spectral features
Bersten et al. (2024) reported flash-ionisation features in early spectra indicative of a dense CSM, lasting several days. We confirm these features in the archival data, with strong Hγ and Hβ emission present within the first ten days post-explosion (Figure 5). Unusually, fast-fading UV lines persist up to day 14, longer than typical for Type II SNe. The early spectra show a blue continuum (Figure 6), characteristic of high-energy explosions and reflecting high-velocity ejecta.
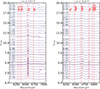 |
Fig. 5. Early-time evolution of the Hα line (left) and ionised Hβ and Fe III lines (right). These lines trace CSM interaction and structure. Epochs are given relative to bolometric maximum (4.1 days post-explosion). The spectra are archival (see Section 3.2). |
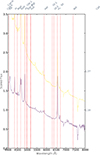 |
Fig. 6. Early-time spectrum of SN 2023ixf at ∼1.3 days post-explosion (MJD 60084.1). The blue continuum is characteristic of high-energy explosions. This spectrum is archival (from Zimmerman et al. 2024). |
In the iron region (Figure 5), we identify a horn-shaped emission feature, also noted by Bostroem et al. (2024), which is likely linked to ejecta asymmetry. A weak Mg II line at ∼4481 Å (marked in Figure 5) suggests early interaction with a cold dense shell overtaken by the reverse shock. The horn feature in the Fe III emission line fades rapidly, indicating ejecta redistribution. Similar behaviour was observed in strongly interacting SNe such as SN 1993J, SN 1995N, and SN 2010jl (Matheson et al. 2000; Zampieri et al. 2005; Fransson et al. 2014).
The Balmer decrement measured at 2.25 days post-explosion gives  , lower than the Case B recombination value of ∼2.85 expected for low-density photo-ionised gas at Te ∼ 104 K (Osterbrock 1989). This deviation indicates significant collisional de-excitation, implying a high electron density in the CSM. Using standard photo-ionisation models (Ilić et al. 2012), we estimate ne ∼ (1 − 5)×108 cm−3 at Te ∼ 104 K. This high density corresponds to material at ∼1015 cm from the progenitor, produced by enhanced mass loss in the final decades before explosion. Our density estimate lies between the higher values (∼109 cm−3) inferred from early radio modelling and lower values from X-ray analyses (Jacobson-Galán et al. 2023; Singh et al. 2024; Nayana et al. 2025), which is consistent with a clumpy, asymmetric CSM where different diagnostics probe different density regimes.
5.2. Late-time DOLoRES spectrum and mass-loss estimation
Our new DOLoRES spectrum obtained at 772.28 days post-explosion (Figure 7) provides one of the latest spectroscopic views of SN 2023ixf in the nebular phase beyond ∼100 days (Jacobson-Galán et al. 2025). The spectrum is dominated by Hα emission with a full width at half maximum (FWHM) corresponding to 704 ± 3 km s−1 (Figure 8).
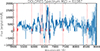 |
Fig. 7. DOLoRES spectrum of SN 2023ixf at 772.28 days post-explosion (MJD 60854). The spectrum covers 6000–9500 Å at a resolution of R ≈ 700. Prominent Hα emission is visible at 6563 Å. |
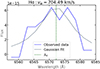 |
Fig. 8. Hα line profile from the DOLoRES spectrum (blue) with Gaussian fit (grey). The FWHM corresponds to a velocity of 704 ± 3 km s−1. |
5.2.1. Interpretation of velocity measurements:
The Hα line width of 704 km s−1 traces shocked CSM observed at late times. In contrast, the velocity vw ≈ 50 km s−1 derived from our light-curve modelling (Section 4) represents the pre-explosion wind speed that established the CSM density profile. These two velocities are physically distinct: the forward shock propagating into a ρ ∝ r−2 wind can accelerate CSM material, producing observed line widths that are a fraction of the shock velocity. The shock velocity at 800 days, estimated from self-similar solutions, is vsh ∼ 3400 km s−1 for typical ejecta parameters, giving vHα/vsh ≈ 0.2. This lower than expected ratio suggests either additional deceleration from a dense outer shell or that Hα emission arises from partially decelerated, off-axis material.
5.2.2. Mass-loss rate estimation:
The measured Hα luminosity is LHα = (13.3 ± 0.6)×1038 erg s−1. We use the relation from Smith et al. (2008) for radiative shocks:
 (4)
(4)
with vw = 50 km s−1 from our light-curve modelling and vsh = 3907 ± 343 km s−1. We note that this equation assumes the shock is radiative and that Hα luminosity traces a fixed fraction of the shock kinetic power. While early forward shocks may be adiabatic (Nayana et al. 2025), by 800 days the shock has likely become radiative as it encounters denser CSM at larger radii. Our choice of vsh represents an average shock velocity from early spectral line widths; using higher early-time velocities (∼104 km s−1) would yield proportionally lower Ṁ estimates. The resulting Ṁ = (3.85 ± 1.03) × 10−5 M⊙ yr−1 reflects mass loss approximately 96 years before explosion, which is consistent with typical RSG wind rates (Mauron & Josselin 2011; Wen et al. 2024; Antoniadis et al. 2024).
5.2.3. CSM mass and radius:
From LHα we estimate the ionised CSM mass Mcsm = (1.56 ± 0.07)×10−3 M⊙. Assuming that a plateau duration of td = 80 days represents the time for the shock to sweep through this material, we obtain Rcsm = tdvsh = (2.70 ± 0.23)×1016 cm. This differs from the estimate by Nayana et al. (2025) (∼5 × 1015 cm) because they assume vsh ≈ 104 km s−1 based on early ejecta velocities, while we use vsh = 3907 km s−1 from our spectral analysis. Both approaches are consistent within the context of decelerating shocks and stratified CSM.
5.3. X-ray constraints on mass-loss history
Late-time ejecta–CSM interaction can produce X-rays via thermal bremsstrahlung (Chevalier & Fransson 2003; Dwarkadas 2025):
 (5)
(5)
Assuming forward-shock dominance (Te/Ti = 1/10, gff = 1, vw = 50 km s−1), our Swift-XRT upper limits (Table 2) yield Ṁ ≤ 2.11 × 10⁻⁴ M⊙ yr−1 at tref = 794.44 days, consistent with constraints at ∼620 days (Jacobson-Galán et al. 2025). This constrains the progenitor’s mass-loss history up to ∼300 years before explosion.
Figure 9 shows the evolution of mass-loss indicators over time. Early elevated values correspond to enhanced mass loss triggered by the SN explosion, while later measurements probe earlier, quiescent mass-loss episodes.
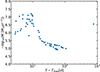 |
Fig. 9. Mass-loss evolution traced by Hα emission measured in all available spectra from the plateau phase onwards. Early elevated values correspond to explosion-triggered enhancement, while the latest measurement (from our DOLoRES spectrum) probes mass loss ∼96 years pre-explosion. |
5.4. Spectral modelling and progenitor constraints
Using CASTOR v2.0, we reconstructed the SED evolution of SN 2023ixf from its photometric data alone. The algorithm selected a template supernova whose multi-band light curves closely match those of SN 2023ixf. The template comes with a time series of spectra covering most phases of its evolution. At each epoch, these template spectra were scaled to match the near-simultaneous observed photometry of SN 2023ixf, thereby reconstructing its SED. From this reconstructed spectral evolution, we infer key physical properties of the supernova and its progenitor.
5.4.1. Expansion velocity and ejecta mass
CASTOR derives expansion velocities by fitting spectral lines with high-degree polynomials and computing Doppler shifts, then averaging over all lines. For the first 110 days post-explosion, we find an ejecta velocity vej = 7090 ± 292 km s−1, which peaks early and then plateaus. This is consistent with previous estimates ranging from 3500 to 10 000 km s−1 (Panjkov et al. 2024; Zimmerman et al. 2024; Yang et al. 2024).
Applying the virial theorem following Arnett (1982), we estimate an ejecta mass of Mej = 4.33 ± 0.56 M⊙, in agreement with Michel et al. (2025), Panjkov et al. (2024), and Yang et al. (2024). In CASTOR (Simongini et al. 2024), the remnant mass is allowed to vary between two extremes: a neutron star (1.2 M⊙) or direct collapse to a black hole (up to 10 M⊙). With these bounds, the inferred progenitor zero-age main-sequence mass ranges from 5.5 to 14.3 M⊙.
5.4.2. Progenitor mass, radius, and temperature constraints
Our analysis yields multiple constraints on the progenitor properties, some of which exhibit occasional discrepancies, underscoring the inherent challenges in accurately determining stellar parameters solely from supernova observations. These inconsistencies reflect the complex nature of the observational data and the limitations of current modeling techniques, highlighting the necessity of a careful, multi-faceted approach when interpreting results to better understand the progenitor’s characteristics. Here we discuss possible interpretations of these findings and their implications.
5.4.2.1. Mass estimates:
We derive progenitor mass estimates through three independent methods. First, light-curve modelling with standard extinction corrections gives MZAMS = 5.5 − 14.3 M⊙ (Section 4). Second, spectral features including the [O I]/[Ca II] ratio (∼1.6) suggest MZAMS = 12 − 15 M⊙ (Fang et al. 2025). Third, nebular spectroscopy provides the most robust mass indicator; using the method of Uomoto (1986),
![Mathematical equation: $$ \begin{aligned} M_{O} = 10^8 f([\mathrm{OI} ]) D^2 e^{2.28/T_4}, \end{aligned} $$](/articles/aa/full_html/2026/02/aa57952-25/aa57952-25-eq9.gif) (6)
(6)
with f([OI]) = 1.86 × 10⁻¹³ erg s−1 cm−2 and T4 = 0.32, we estimate MO ≈ 1.14 M⊙. Assuming 50% of oxygen is in the [O I] doublet, the total oxygen mass is ≲2.28 M⊙, which corresponds to MZAMS = 17 − 19 M⊙ according to nucleosynthesis models (Figure 11) (Gangopadhyay et al. 2020). This ∼8 M⊙ discrepancy between light-curve and spectroscopic mass estimates mirrors the broader ‘red supergiant problem’ (Davies & Beasor 2020).
5.4.2.2. Radius determination:
We constrain the progenitor radius using the scaling relation from Kasen & Woosley (2009):
 (7)
(7)
where ET is the time-weighted integrated bolometric luminosity (Nakar et al. 2016). From our CASTOR analysis, we obtain ET = (1.36 ± 0.41)×1055 erg, which is slightly lower than but consistent with previous estimates of (3.3 − 7.7)×1055 erg (Zimmerman et al. 2024; Yang et al. 2024). Combining this with Mej = 4.33 ± 0.56 M⊙ and vej = 7090 ± 292 km s−1 yields Rpr = 318 ± 80 R⊙.
5.4.2.3. Temperature and luminosity:
Pre-explosion imaging studies give progenitor luminosity estimates in the range log(L/L⊙) = 4.7 − 5.27 (Hosseinzadeh et al. 2023; Jencson et al. 2023; Kilpatrick et al. 2023; Neustadt et al. 2024; Niu et al. 2023; Qin et al. 2024; Soraisam et al. 2023; Van Dyk et al. 2024; Xiang et al. 2024). Applying the Stefan-Boltzmann law with our radius estimate gives an effective temperature of Teff = 4235 − 7572 K. This is somewhat higher than previous estimates of 3100–3500 K; the discrepancy may arise from systematic differences in radius determination or bolometric corrections applied to pre-explosion photometry.
5.4.2.4. Interpretation:
The derived parameters (Rpr ∼ 300 R⊙, Teff ∼ 4000 − 7500 K) are consistent with an intermediate-mass RSG rather than a very extended, cool massive RSG (R ≳ 1000 R⊙, Teff ∼ 3000 − 3500 K). The moderately compact radius and elevated temperature could indicate partial envelope stripping or enhanced pre-explosion mass loss, consistent with the strong CSM interaction observed at early times. The mass discrepancy between methods highlights the importance of accounting for circumstellar extinction when inferring progenitor properties from pre-explosion imaging or early light curves.
5.4.3. Late-time spectral analysis: DOLoRES spectrum
Our new DOLoRES spectrum obtained at 772.28 days post-explosion (Figure 7) provides one of the latest spectroscopic views of SN 2023ixf in the nebular phase beyond ∼100 days. The spectrum is dominated by Hα emission with a FWHM corresponding to 704 ± 3 km s−1 (Figure 8). This width is significantly broader than expected from unshocked circumstellar material and indicates that the emitting gas has been accelerated by the forward shock.
The measured Hα luminosity is LHα = (13.3 ± 0.6)×1038 erg s−1. Using the relation from Smith et al. (2008) for radiative shocks,
 (8)
(8)
with shock velocity vsh = 3907 ± 343 km s−1 derived from early-time line widths, we obtain a mass-loss rate of Ṁ = (3.85 ± 1.03) × 10−5 M⊙ yr−1. This reflects the progenitor’s mass loss approximately 96 years before explosion, consistent with typical RSG wind rates (Mauron & Josselin 2011; Wen et al. 2024; Antoniadis et al. 2024). The asymmetric Hα profile suggests ongoing CSM interaction, pointing to episodic pre-SN mass loss.
The wind speed derived from the Hα line width (≈704 km s−1) traces shocked circumstellar material observed at late times, whereas the slower velocity inferred from our light-curve modelling (≈50 km s−1; Section 4) represents the pre-explosion wind speed that set the CSM density profile. These are physically linked; the forward shock propagating into a CSM shaped by a ∼50 km s−1 wind can accelerate and compress parts of that material, raising its observed velocity to several hundred km s−1 once it becomes radiatively cooled and visible in Hα. This picture is consistent with a stratified or clumpy CSM where slower, denser ejecta from earlier mass-loss episodes are overtaken and re-energised by the faster shock.
In addition to Hα, the DOLoRES spectrum enables a nebular diagnostic of the progenitor’s core. Using the late-time [O I] λλ6300, 6363 line flux from this spectrum, we applied the formulation of Uomoto (1986):
![Mathematical equation: $$ \begin{aligned} M_{O} = 10^8 f([\mathrm{OI} ]) D^2 e^{\frac{2.28}{T_4}}, \end{aligned} $$](/articles/aa/full_html/2026/02/aa57952-25/aa57952-25-eq12.gif) (9)
(9)
with f([OI]) = (1.86 ± 0.12)×10−13 erg s−1 cm−2 and T4 = 0.32 ± 0.02, obtaining MO ≈ 1.14 ± 0.11 M⊙. Assuming a 50% contribution from each component of the doublet, the total oxygen mass is ≲2.28 ± 0.22 M⊙. This value agrees with nebular spectral modelling for core-collapse SNe (Gangopadhyay et al. 2020), which indicates a progenitor zero-age main-sequence mass of 17–19 M⊙. This range stands in clear contrast to the lower mass (5.5 − 14.3 M⊙) inferred from light-curve modelling with standard extinction corrections, highlighting the importance of late-time nebular spectroscopy for robust progenitor mass determination.
6. Discussion
Our work provides several advances beyond previous studies of SN 2023ixf. First, we achieve extensive temporal coverage by connecting observational phases ranging from 2.25 to 772.28 days through a consistent analysis framework. Additionally, we incorporate novel data, including spectra obtained beyond 710 days and SiFAP2 photometry calibrated with a custom supernova reference. We further ensure robustness by applying a multi-method consistency approach, cross-checking results from light curve, spectral, and nebular diagnostics. Finally, we employ a quantitative dust modeling technique within a Bayesian framework that links the properties of the circumstellar medium to the progenitor’s mass-loss bias. Together, these advances enable us to reconstruct the progenitor’s mass-loss history with unprecedented detail.
6.1. Early-to-late evolution: Connecting CSM signatures
SN 2023ixf exhibits clear signatures of CSM interaction from the earliest phases through to the latest observations. Early spectra (< ten days post-explosion) show flash-ionisation features and a high Balmer decrement ( ), indicating dense, photo-ionised circumstellar material with ne ∼ 108 cm−3. This points to enhanced mass loss in the final decades before explosion.
At intermediate phases (30–70 days), Hα emission narrows progressively as recombination proceeds in receding layers, with velocities declining to ∼1000 km s−1 by the end of the plateau. This behaviour is seen in other Type II-P SNe such as SN 2018gj and SN 2008bk (Teja et al. 2023; Lisakov et al. 2017).
Our new late-time observations reveal the transition from 56Co-powered decay to shock-powered emission. After ∼500 days in the optical and ∼200 days in the UV, the light curve deviates from radioactive decay models and follows  (Figure 3), indicating ongoing interaction with CSM ejected ∼175 years pre-explosion. The DOLoRES spectrum at 772.28 days shows broad Hα emission (704 ± 3 km s−1) from shock-accelerated material, consistent with forward-shock propagation through a stratified CSM.
This continuum of CSM signatures–from early flash ionisation through plateau-phase recombination to late-time shock interaction–indicates that SN 2023ixf’s progenitor experienced multiple mass-loss episodes over different timescales: enhanced ejection in the final decades, preceded by more quiescent mass loss extending back centuries.
6.2. Reconciling progenitor mass estimates: The role of circumstellar dust
Our Bayesian modelling (Section 4.2) provides a quantitative framework for understanding how circumstellar dust affects progenitor mass estimates. The key result is that even moderate CSM extinction (AV, CSM ∼ 1–2 mag) can bias luminosity-based mass estimates downwards by ∼8 M⊙ for a progenitor near 18 M⊙. This bias arises from the steep mass–luminosity relation for RSGs (L ∝ Mα with α ∼ 3–4), which amplifies the effect of modest luminosity underestimation.
The model’s preference for a large total CSM mass (∼56 M⊙) compared to the ionised gas mass (∼0.001 M⊙) points to a highly clumped dust distribution. Assuming the dust resides in dense clumps with a covering factor, fc, we can estimate fc ∼ Mdust, Hα/Mdust, MCMC ∼ 10−4–10−5, meaning only ∼0.01–0.1% of the sky as seen from the progenitor is covered by dust-enshrouded clumps. Such geometry is plausible for RSGs with episodic mass loss, where dust forms preferentially in dense, cool regions of enhanced outflow. This strongly suggests a clumpy or anisotropic dust distribution, where modest total dust mass concentrated along the line of sight can produce significant extinction without requiring uniformly high gas densities. Such geometry is consistent with the asymmetric Hα profiles observed at late times and with the complex, stratified CSM inferred from early spectral features.
This has important implications for the RSG problem. If massive RSGs (MZAMS ≳ 17 M⊙) typically experience enhanced late-stage mass loss that produces clumpy, dust-rich CSM, then their pre-explosion luminosities will be systematically underestimated. Near-infrared searches may partially mitigate this bias, but even at the K-band, dust extinction remains significant (AK ∼ 0.1AV). Our analysis suggests that progenitor mass estimates based solely on optical pre-explosion photometry should be treated as lower limits, with systematic uncertainties of ∼5–10 M⊙ possible for stars with substantial CSM.
The case of SN 2023ixf demonstrates that combining multiple diagnostics–early-time flash spectroscopy, late-time shock emission, and nebular line analysis–can break degeneracies between progenitor mass and circumstellar extinction. Future studies of nearby SNe should prioritise such multi-epoch, multi-wavelength approaches to obtain robust progenitor constraints.
6.3. Implications for the red supergiant problem
SN 2023ixf serves as a benchmark case for understanding the RSG problem. Pre-explosion imaging excludes MZAMS ≳ 22 M⊙ (Rest et al. 2025), while our analysis indicates the actual progenitor likely had MZAMS ≈ 17 − 19 M⊙–near the upper end of directly detected RSG progenitors. Several factors may contribute to the apparent scarcity of higher-mass progenitors:
-
Circumstellar extinction: As demonstrated here, even moderate CSM dust can lower inferred luminosities by ∼1–2 mag, biasing mass estimates downwards by ∼5–10 M⊙. Near-infrared searches may recover some obscured progenitors (Kochanek et al. 2012).
-
Systematic biases: Single-band photometry, uncertain bolometric corrections, and incomplete SED coverage can shift mass estimates by several solar masses (Davies & Beasor 2020).
-
Stellar evolution effects: Binary interaction, enhanced mass loss, or envelope stripping may alter the final states of massive RSGs, leading to different SN subtypes or faint explosions (Zapartas et al. 2021).
-
Failed explosions: Some massive RSGs may collapse directly to black holes without luminous SNe (Sukhbold et al. 2016).
For SN 2023ixf, circumstellar extinction appears to be the dominant factor reconciling the observed discrepancies. The progenitor’s mass-loss history – traced from early dense CSM to late distant shells – created a dust-rich environment capable of obscuring the star without requiring anomalously high total mass loss.
6.4. SN 2023ixf in the context of Type II SNe
Despite its proximity and exceptional coverage, SN 2023ixf is not an outlier among Type II SNe. Its bolometric light-curve parameters fall within the distributions of the Carnegie Supernova Project sample (Figure 10), and its spectral evolution follows patterns seen in other well-studied events like SN 2013ej and SN 2013by. The main distinguishing feature is the clear evidence of multi-epoch CSM interaction, which may be present but less detectable in more distant SNe.
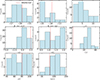 |
Fig. 10. Comparison of SN2023ixf bolometric light curve with Type-II population from Carnegie Supernova project (Martinez et al. 2022). The features are those reported in Martinez et al. (2022): M_bol_end is the bolometric magnitude measured 30 d before tPT (midpoint of the plateau–tail transition). If tPT is not defined, this is the magnitude of the last observation during the optically thick phase; M_bol_tail is the bolometric magnitude 30 d after tPT. If the transition is not well defined but the tail is observed, this is the magnitude at the closest point after the transition; s1 is the decline rate (mag/100 d) of the early cooling phase, obtained from a linear fit; s2 is the decline rate of the plateau phase, obtained from a linear fit; s3 is the decline rate of the radioactive tail, obtained from a linear fit with at least three data points; Cd is the cooling phase duration, from texplosion to ttrans; pd is the plateau duration, tPT − ttrans; optd is the optically thick phase duration, tPT (if texplosion is known). When possible, we estimated the parameters following the formalism in Martinez et al. (2022). The values are within the distributions for each of the parameters; the only value we could not estimate is s1, due to the lack of data in the time range defined to infer this parameter. |
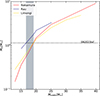 |
Fig. 11. Comparison of the estimated oxygen mass at ≈800 d from the explosion with the expected value from the nucleosynthesis models at different MZAMS. |
This suggests that many Type II SNe may have similar complex CSM structures, but only nearby, well-monitored events like SN 2023ixf allow detailed dissection of the mass-loss history. The event thus provides an analogue for interpreting observations of more distant SNe where only limited phases are observable.
7. Conclusions
We present new observational constraints on SN 2023ixf’s late-time evolution: SiFAP2 photometry to 772 d, Swift detections to 801 d, and one of the latest DOLoRES spectra (772 d). Our custom calibration of the SiFAP2 white-light data enabled precise photometry despite the instrument’s black-body assumption, extending the optical light curve into the shock-interaction phase. The main results of this work are the following:
-
Late-time shock interaction: The light curve deviates from radioactive decay after ∼500 d, following L ∝ t−1 as expected for forward-shock propagation into a ρ ∝ r−2 wind. Our DOLoRES spectrum at 772.28 d shows broad Hα emission (704 ± 3 km s−1), directly confirming shock-accelerated CSM.
-
Multi-phase CSM history: Early flash ionisation (ne ∼ 108 cm−3) points to enhanced mass loss in the final decades, while late-time flattening traces material ejected ∼175 yr before explosion. This indicates episodic mass-loss activity spanning centuries.
-
Progenitor mass discrepancy resolved by dust: Light-curve modelling yields MZAMS = 5.5–14.3 M⊙, whereas the nebular oxygen mass (∼2.3 M⊙) and [O I]/[Ca II] ratio point to MZAMS = 17–19 M⊙. Our Bayesian Monte-Carlo framework shows that anisotropic CSM dust producing AV, CSM ∼ 1–2 mag can bias luminosity-based masses downwards by ∼8 M⊙, reconciling the estimates with a median corrected mass of 17.72 M⊙.
-
Clumpy CSM geometry: The dust model favours a total CSM mass of ∼56 M⊙, which is orders of magnitude larger than the ionised gas mass traced by Hα (∼0.001 M⊙). This implies a covering factor of fc ∼ 10−4–10−5, consistent with dust confined to dense clumps rather than a smooth shell.
-
Implications for the RSG problem: SN 2023ixf’s progenitor likely had MZAMS ≈ 17–19 M⊙–near the upper limit of directly detected RSG progenitors. Circumstellar dust obscuration is thus a major factor in the apparent scarcity of high-mass RSG detections, biasing luminosity-based estimates by several solar masses.
7.1. Limitations and future prospects.
Our Bayesian dust model assumes a simplified geometry; 3D radiative-transfer simulations would better constrain clumpiness and viewing-angle effects. The single late-time spectrum limits our ability to trace shock evolution, while X-ray non-detections only provide upper limits on current shock power. Future facilities (the James Webb Space Telescope for mid-IR dust emission, the Vera C. Rubin Observatory for high-cadence optical monitoring, next-generation X-ray telescopes) will enable similar detailed studies for larger SN samples. Coupled with stellar-evolution models that self-consistently treat late-stage mass loss and dust formation, such observations will clarify whether the RSG problem stems primarily from observational biases or reflects intrinsic limits on massive-star evolution.
SN 2023ixf demonstrates that robust progenitor-mass determination requires combining multi-epoch photometry, spectroscopy, and explicit CSM modelling. As one of the best-studied nearby core-collapse supernovae in decades, it provides a benchmark for interpreting observations of more distant events and advances our understanding of the final stages of massive stellar evolution.
Acknowledgments
We acknowledge the use of the ADHOC (Astrophysical Data HPC Operating Center) resources, within the project “Strengthening the Italian Leadership in ELT and SKA (STILES)”, proposal nr. IR0000034, admitted and eligible for funding from the funds referred to in the D.D. prot. no. 245 of August 10, 2022 and D.D. 326 of August 30, 2022, funded under the programme “Next Generation EU” of the European Union, “Piano Nazionale di Ripresa e Resilienza” (PNRR) of the Italian Ministry of University and Research (MUR), “Fund for the creation of an integrated system of research and innovation infrastructures”, Action 3.1.1 “Creation of new IR or strengthening of existing IR involved in the Horizon Europe Scientific Excellence objectives and the establishment of networks. This work received financial support from INAF through the GRAWITA 2022 Large programme Grant.
References
- Abac, A. G., Abbott, R., Abouelfettouh, I., et al. 2025, ApJ, 985, 183 [Google Scholar]
- Andrews, J. E., Shrestha, M., Bostroem, K. A., et al. 2025, ApJ, 980, 37 [Google Scholar]
- Antoniadis, K., Bonanos, A. Z., de Wit, S., et al. 2024, A&A, 686, A88 [NASA ADS] [CrossRef] [EDP Sciences] [Google Scholar]
- Arnett, W. D. 1982, ApJ, 253, 785 [Google Scholar]
- Beasor, E. R., & Davies, B. 2017, MNRAS, 475, 55 [Google Scholar]
- Bersten, M., Orellana, M., Folatelli, G., et al. 2024, A&A, 681, L18 [NASA ADS] [CrossRef] [EDP Sciences] [Google Scholar]
- Bertin, E., & Arnouts, S. 1996, A&AS, 117, 393 [NASA ADS] [CrossRef] [EDP Sciences] [Google Scholar]
- Black, C. S., Milisavljevic, D., Margutti, R., et al. 2017, ApJ, 848, 5 [NASA ADS] [CrossRef] [Google Scholar]
- Bose, S., Sutaria, F., Kumar, B., et al. 2015, ApJ, 806, 160 [Google Scholar]
- Bostroem, K. A., Sand, D. J., Dessart, L., et al. 2024, ApJ, 973, L47 [NASA ADS] [CrossRef] [Google Scholar]
- Chevalier, R. A., & Fransson, C. 2003, Supernovae and Gamma-ray Bursters (Springer), 171 [Google Scholar]
- Davies, B., & Beasor, E. R. 2020, MNRAS, 493, 468 [NASA ADS] [CrossRef] [Google Scholar]
- Decleir, M., De Looze, I., Boquien, M., et al. 2019, MNRAS, 486, 743 [NASA ADS] [CrossRef] [Google Scholar]
- Dwarkadas, V. V. 2025, Universe, 11, 161 [Google Scholar]
- Fang, Q., Moriya, T. J., Ferrari, L., et al. 2025, ApJ, 978, 36 [NASA ADS] [CrossRef] [Google Scholar]
- Ferrari, L., Folatelli, G., Ertini, K., Kuncarayakti, H., & Andrews, J. E. 2024, A&A, 687, L20 [NASA ADS] [CrossRef] [EDP Sciences] [Google Scholar]
- Fransson, C., Lundqvist, P., & Chevalier, R. A. 1996, ApJ, 461, 993 [NASA ADS] [CrossRef] [Google Scholar]
- Fransson, C., Ergon, M., Challis, P. J., et al. 2014, ApJ, 797, 118 [Google Scholar]
- Gangopadhyay, A., Misra, K., Sahu, D. K., et al. 2020, MNRAS, 497, 3770 [Google Scholar]
- Ghedina, A., Leone, F., Ambrosino, F., et al. 2018, in Proceedings of the SPIE, eds. C. J. Evans, L. Simard, & H. Takami, SPIE Conf. Ser., 10702, 107025Q [Google Scholar]
- Grefenstette, B. W., Brightman, M., Earnshaw, H. P., Harrison, F. A., & Margutti, R. 2023, ApJ, 952, L3 [NASA ADS] [CrossRef] [Google Scholar]
- Guetta, D., Langella, A., Gagliardini, S., & Della Valle, M. 2023, ApJ, 955, L9 [Google Scholar]
- Hiramatsu, D., Tsuna, D., Berger, E., et al. 2023, ApJ, 955, L8 [NASA ADS] [CrossRef] [Google Scholar]
- Hosseinzadeh, G., Farah, J., Shrestha, M., et al. 2023, ApJ, 953, L16 [NASA ADS] [CrossRef] [Google Scholar]
- Ilić, D., Popović, L. Č., La Mura, G., Ciroi, S., & Rafanelli, P. 2012, A&A, 543, A142 [NASA ADS] [CrossRef] [EDP Sciences] [Google Scholar]
- Itagaki, K. 2023, Transient Name Server Discovery Report, 2023–1158, 1 [Google Scholar]
- Jacobson-Galán, W. V., Dessart, L., Margutti, R., et al. 2023, ApJ, 954, L42 [CrossRef] [Google Scholar]
- Jacobson-Galán, W. V., Dessart, L., Kilpatrick, C. D., et al. 2025, ApJ, 994, L14 [Google Scholar]
- Jencson, J. E., Pearson, J., Beasor, E. R., et al. 2023, ApJ, 952, L30 [NASA ADS] [CrossRef] [Google Scholar]
- Kafka, S., Weaver, J., Silvis, G., & Beck, S. 2018, AAS Meeting Abstr., 231, 362.15 [Google Scholar]
- Kasen, D., & Woosley, S. E. 2009, ApJ, 703, 2205 [NASA ADS] [CrossRef] [Google Scholar]
- Kilpatrick, C. D., Foley, R. J., Jacobson-Galán, W. V., et al. 2023, ApJ, 952, L23 [NASA ADS] [CrossRef] [Google Scholar]
- Kochanek, C. S., Khan, R., & Dai, X. 2012, ApJ, 759, 20 [NASA ADS] [CrossRef] [Google Scholar]
- Li, G., Hu, M., Li, W., et al. 2024, Nature, 627, 754 [NASA ADS] [CrossRef] [Google Scholar]
- Lisakov, S. M., Dessart, L., Hillier, D. J., Waldman, R., & Livne, E. 2017, MNRAS, 466, 34 [Google Scholar]
- Margutti, R., Soderberg, A. M., Chomiuk, L., et al. 2012, ApJ, 751, 134 [Google Scholar]
- Martí-Devesa, G., Cheung, C., Di Lalla, N., et al. 2024, A&A, 686, A254 [NASA ADS] [CrossRef] [EDP Sciences] [Google Scholar]
- Martinez, L., Bersten, M. C., Anderson, J. P., et al. 2022, A&A, 660, A40 [NASA ADS] [CrossRef] [EDP Sciences] [Google Scholar]
- Martinez, L., Bersten, M. C., Folatelli, G., Orellana, M., & Ertini, K. 2024, A&A, 683, A154 [NASA ADS] [CrossRef] [EDP Sciences] [Google Scholar]
- Matheson, T., Filippenko, A. V., Ho, L. C., Barth, A. J., & Leonard, D. C. 2000, AJ, 120, 1499 [NASA ADS] [CrossRef] [Google Scholar]
- Matsumoto, T., & Metzger, B. D. 2022, ApJ, 936, 114 [CrossRef] [Google Scholar]
- Matthews, D., Margutti, R., Nayana, A. J., et al. 2023, Transient Name Server AstroNote, 180, 1 [Google Scholar]
- Mauron, N., & Josselin, E. 2011, A&A, 526, A156 [CrossRef] [EDP Sciences] [Google Scholar]
- Mayya, Y. D., Carrasco, L., Escobedo, G., et al. 2023, ATel, 16300, 1 [Google Scholar]
- Michel, P. D., Mazzali, P. A., Perley, D. A., Hinds, K. R., & Wise, J. L. 2025, MNRAS, staf443 [Google Scholar]
- Moriya, T. J., & Singh, A. 2024, PASJ, 76, 1050 [NASA ADS] [CrossRef] [Google Scholar]
- Nakar, E., Poznanski, D., & Katz, B. 2016, ApJ, 823, 127 [CrossRef] [Google Scholar]
- Nayana, A., Margutti, R., Wiston, E., et al. 2025, ApJ, 985, 51 [Google Scholar]
- Neustadt, J. M. M., Kochanek, C. S., & Smith, M. R. 2024, MNRAS, 527, 5366 [Google Scholar]
- Nicholl, M. 2018, Res. Notes Am. Astron. Soc., 2, 230 [NASA ADS] [Google Scholar]
- Niu, Z., Sun, N.-C., Maund, J. R., et al. 2023, ApJ, 955, L15 [NASA ADS] [CrossRef] [Google Scholar]
- Osterbrock, D. E. 1989, Astrophysics of Gaseous Nebulae and Active Galactic Nuclei [Google Scholar]
- Panjkov, S., Auchettl, K., Shappee, B. J., et al. 2024, PASA, 41, e059a [Google Scholar]
- Perley, D., & Gal-Yam, A. 2023, Transient Name Server Classif. Rep., 2023–1164, 1 [Google Scholar]
- Perley, D. A., Gal-Yam, A., Irani, I., & Zimmerman, E. 2023, Transient Name Server AstroNote, 119, 1 [NASA ADS] [Google Scholar]
- Qin, Y.-J., Zhang, K., Bloom, J., et al. 2024, MNRAS, 534, 271 [NASA ADS] [CrossRef] [Google Scholar]
- Rest, S., Rest, A., Kilpatrick, C., et al. 2025, ApJ, 979, 114 [Google Scholar]
- Schlafly, E. F., & Finkbeiner, D. P. 2011, ApJ, 737, 103 [Google Scholar]
- Schlegel, D. J., Finkbeiner, D. P., & Davis, M. 1998, ApJ, 500, 525 [Google Scholar]
- Simongini, A., Ragosta, F., Piranomonte, S., & Di Palma, I. 2024, MNRAS, stae1911 [Google Scholar]
- Simongini, A., Ragosta, F., Piranomonte, S., & Di Palma, I. 2025, CASTOR: v2.0 - 2025–03-05 [Google Scholar]
- Singh, A., Teja, R. S., Moriya, T. J., et al. 2024, ApJ, 975, 132 [CrossRef] [Google Scholar]
- Smith, N., Chornock, R., Li, W., et al. 2008, ApJ, 686, 467 [NASA ADS] [CrossRef] [Google Scholar]
- Soraisam, M. D., Szalai, T., Van Dyk, S. D., et al. 2023, ApJ, 957, 64 [NASA ADS] [CrossRef] [Google Scholar]
- Sukhbold, T., Ertl, T., Woosley, S. E., Brown, J. M., & Janka, H. T. 2016, ApJ, 821, 38 [NASA ADS] [CrossRef] [Google Scholar]
- Teja, R. S., Singh, A., Sahu, D. K., et al. 2023, ApJ, 954, 155 [Google Scholar]
- Terreran, G., Jerkstrand, A., Benetti, S., et al. 2016, MNRAS, 462, 137 [Google Scholar]
- Uomoto, A. 1986, ApJ, 310, L35 [NASA ADS] [CrossRef] [Google Scholar]
- Valenti, S., Sand, D., Pastorello, A., et al. 2014, MNRAS, 438, L101 [Google Scholar]
- Valenti, S., Sand, D., Stritzinger, M., et al. 2015, MNRAS, 448, 2608 [NASA ADS] [CrossRef] [Google Scholar]
- Van Dyk, S. D., Srinivasan, S., Andrews, J. E., et al. 2024, ApJ, 968, 27 [NASA ADS] [CrossRef] [Google Scholar]
- Walmswell, J. J., & Eldridge, J. J. 2012, MNRAS, 419, 2054 [CrossRef] [Google Scholar]
- Wen, J., Yang, M., Gao, J., et al. 2024, ApJS, 275, 33 [Google Scholar]
- Xiang, D., Mo, J., Wang, L., et al. 2024, Sci. China Phys. Mech. Astron, 67, 219514 [Google Scholar]
- Yang, Y.-P., Liu, X., Pan, Y., et al. 2024, ApJ, 969, 126 [Google Scholar]
- Yaron, O., & Gal-Yam, A. 2012, PASP, 124, 668 [Google Scholar]
- Yoon, S.-C., Chun, W., Tolstov, A., Blinnikov, S., & Dessart, L. 2019, ApJ, 872, 174 [NASA ADS] [CrossRef] [Google Scholar]
- Zampieri, L., Mucciarelli, P., Pastorello, A., et al. 2005, MNRAS, 364, 1419 [Google Scholar]
- Zapartas, E., de Mink, S. E., Justham, S., et al. 2021, A&A, 645, A6 [NASA ADS] [CrossRef] [EDP Sciences] [Google Scholar]
- Zimmerman, E. A., Irani, I., Chen, P., et al. 2024, Nature, 627, 759 [Google Scholar]
All Tables
All Figures
|
Fig. 1. Detection of SN 2023ixf on MJD 60884.11 (801.36 days post-explosion) with Swift-UVOT in the V band. |
| In the text | |
|
Fig. 2. Comparison between SN 2023ixf (brown), SN 2013by (blue), SN 2013ej (green), SN 2014G (red), and SN 2024bch (gold) light curves. We only show the filters for which data are available for all the aforementioned supernovae: (top row) m2, w1, w2; (middle row) U, B, V; (bottom row) g, r, i. The SN 2023ixf data points are interpolated with GPs. The SN 2023ixf observation in the V-band at ∼800 days post-explosion is not used for comparison. The red line is the GP regression model for the SN data in the selected band. |
| In the text | |
|
Fig. 3. V-band light-curve evolution of SN 2023ixf. Between 100 and 450 days post-explosion, the decline is well described by a radioactive decay model, tested under both full and incomplete γ-ray trapping scenarios. At later epochs, however, the SiFAP2 and Swift-UVOT measurements (700–800 days post-explosion) lie significantly above the radioactive-decay fits. These very late-time data are instead reproduced by a shock-powered model of the form |
| In the text | |
|
Fig. 4. Evolution of the bolometric light curve, the black-body temperature, the photometric radius, and the colour evolution (from top to bottom). Except for the colour evolution, all trends are derived from SuperBol fits to the multi-band photometry. The insets zoom in on the first 70 days post-explosion. See Sect. 4.1 for details. |
| In the text | |
|
Fig. 5. Early-time evolution of the Hα line (left) and ionised Hβ and Fe III lines (right). These lines trace CSM interaction and structure. Epochs are given relative to bolometric maximum (4.1 days post-explosion). The spectra are archival (see Section 3.2). |
| In the text | |
|
Fig. 6. Early-time spectrum of SN 2023ixf at ∼1.3 days post-explosion (MJD 60084.1). The blue continuum is characteristic of high-energy explosions. This spectrum is archival (from Zimmerman et al. 2024). |
| In the text | |
|
Fig. 7. DOLoRES spectrum of SN 2023ixf at 772.28 days post-explosion (MJD 60854). The spectrum covers 6000–9500 Å at a resolution of R ≈ 700. Prominent Hα emission is visible at 6563 Å. |
| In the text | |
|
Fig. 8. Hα line profile from the DOLoRES spectrum (blue) with Gaussian fit (grey). The FWHM corresponds to a velocity of 704 ± 3 km s−1. |
| In the text | |
|
Fig. 9. Mass-loss evolution traced by Hα emission measured in all available spectra from the plateau phase onwards. Early elevated values correspond to explosion-triggered enhancement, while the latest measurement (from our DOLoRES spectrum) probes mass loss ∼96 years pre-explosion. |
| In the text | |
|
Fig. 10. Comparison of SN2023ixf bolometric light curve with Type-II population from Carnegie Supernova project (Martinez et al. 2022). The features are those reported in Martinez et al. (2022): M_bol_end is the bolometric magnitude measured 30 d before tPT (midpoint of the plateau–tail transition). If tPT is not defined, this is the magnitude of the last observation during the optically thick phase; M_bol_tail is the bolometric magnitude 30 d after tPT. If the transition is not well defined but the tail is observed, this is the magnitude at the closest point after the transition; s1 is the decline rate (mag/100 d) of the early cooling phase, obtained from a linear fit; s2 is the decline rate of the plateau phase, obtained from a linear fit; s3 is the decline rate of the radioactive tail, obtained from a linear fit with at least three data points; Cd is the cooling phase duration, from texplosion to ttrans; pd is the plateau duration, tPT − ttrans; optd is the optically thick phase duration, tPT (if texplosion is known). When possible, we estimated the parameters following the formalism in Martinez et al. (2022). The values are within the distributions for each of the parameters; the only value we could not estimate is s1, due to the lack of data in the time range defined to infer this parameter. |
| In the text | |
|
Fig. 11. Comparison of the estimated oxygen mass at ≈800 d from the explosion with the expected value from the nucleosynthesis models at different MZAMS. |
| In the text | |
Current usage metrics show cumulative count of Article Views (full-text article views including HTML views, PDF and ePub downloads, according to the available data) and Abstracts Views on Vision4Press platform.
Data correspond to usage on the plateform after 2015. The current usage metrics is available 48-96 hours after online publication and is updated daily on week days.
Initial download of the metrics may take a while.