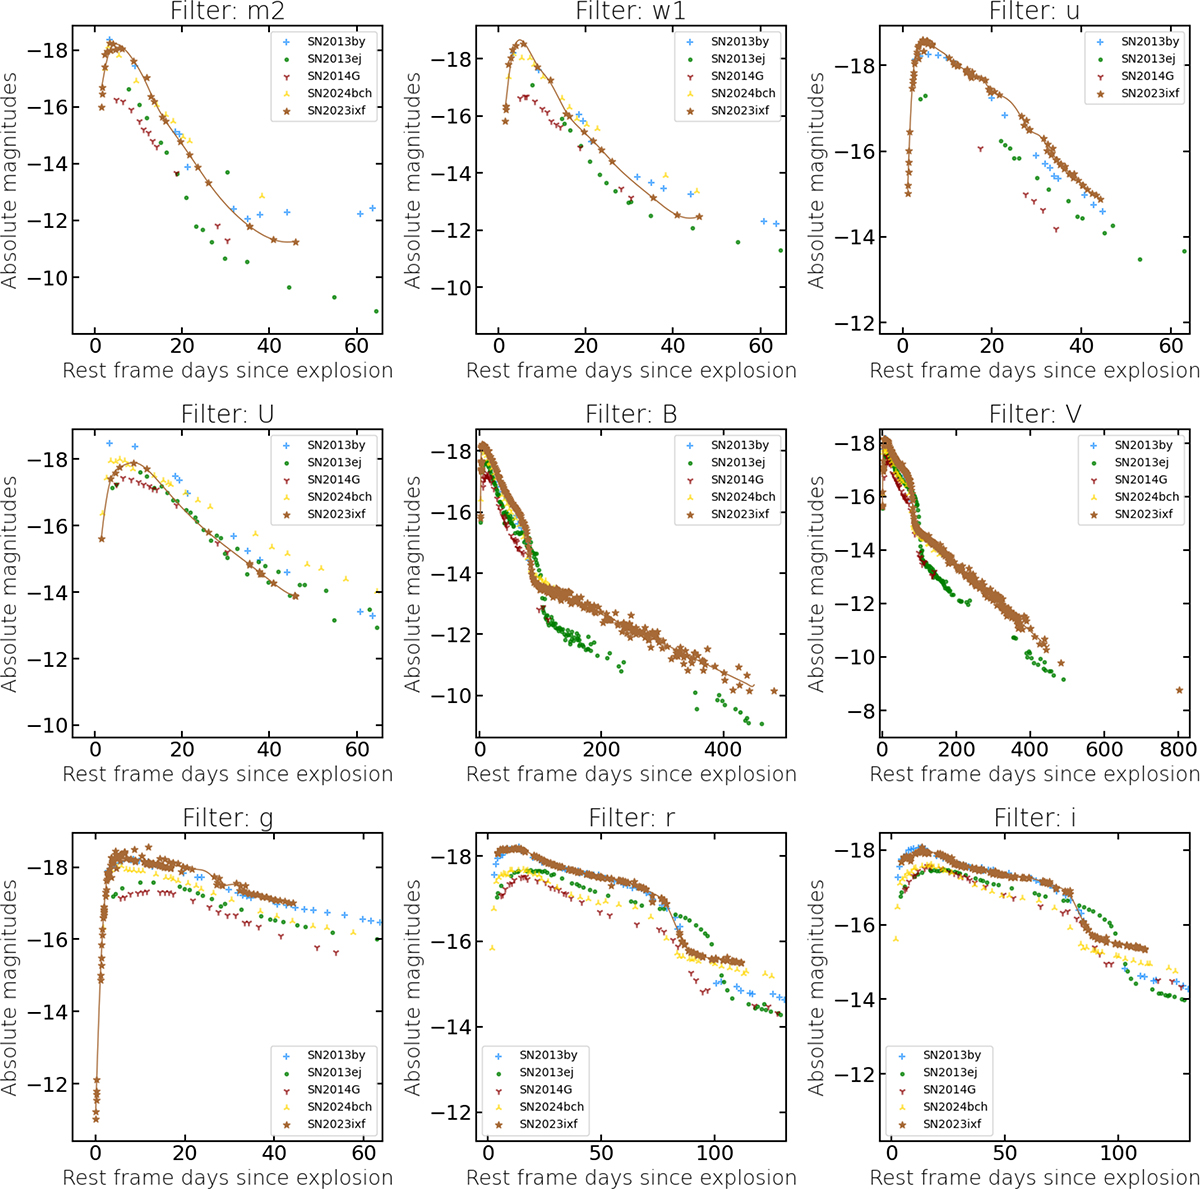
Fig. 2.
Download original image
Comparison between SN 2023ixf (brown), SN 2013by (blue), SN 2013ej (green), SN 2014G (red), and SN 2024bch (gold) light curves. We only show the filters for which data are available for all the aforementioned supernovae: (top row) m2, w1, w2; (middle row) U, B, V; (bottom row) g, r, i. The SN 2023ixf data points are interpolated with GPs. The SN 2023ixf observation in the V-band at ∼800 days post-explosion is not used for comparison. The red line is the GP regression model for the SN data in the selected band.
Current usage metrics show cumulative count of Article Views (full-text article views including HTML views, PDF and ePub downloads, according to the available data) and Abstracts Views on Vision4Press platform.
Data correspond to usage on the plateform after 2015. The current usage metrics is available 48-96 hours after online publication and is updated daily on week days.
Initial download of the metrics may take a while.