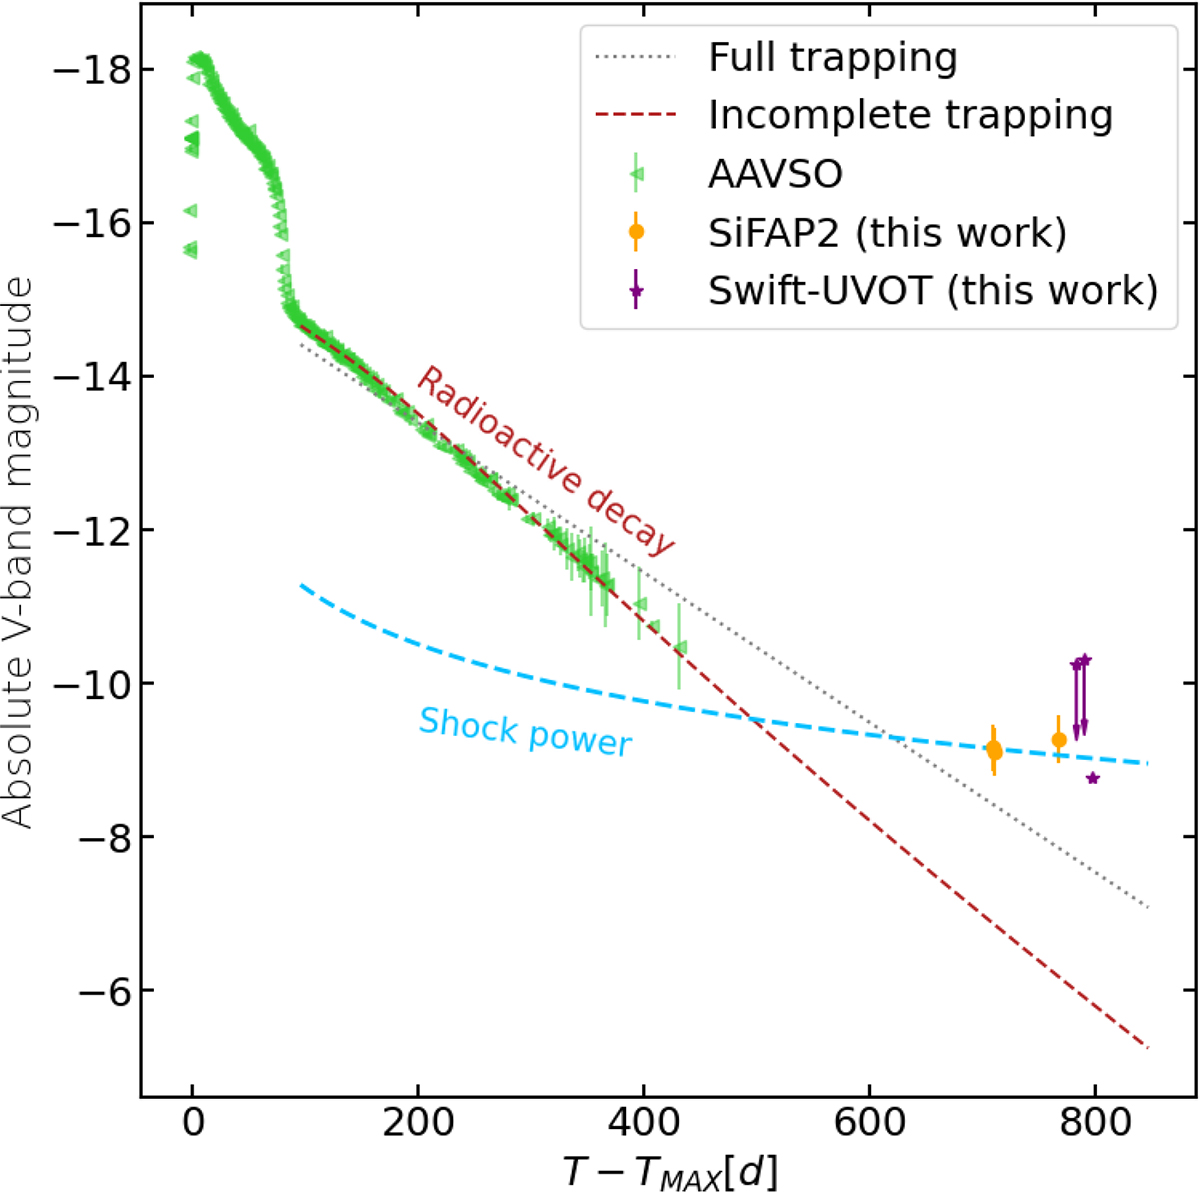
Fig. 3.
Download original image
V-band light-curve evolution of SN 2023ixf. Between 100 and 450 days post-explosion, the decline is well described by a radioactive decay model, tested under both full and incomplete γ-ray trapping scenarios. At later epochs, however, the SiFAP2 and Swift-UVOT measurements (700–800 days post-explosion) lie significantly above the radioactive-decay fits. These very late-time data are instead reproduced by a shock-powered model of the form ![]() .
.
Current usage metrics show cumulative count of Article Views (full-text article views including HTML views, PDF and ePub downloads, according to the available data) and Abstracts Views on Vision4Press platform.
Data correspond to usage on the plateform after 2015. The current usage metrics is available 48-96 hours after online publication and is updated daily on week days.
Initial download of the metrics may take a while.