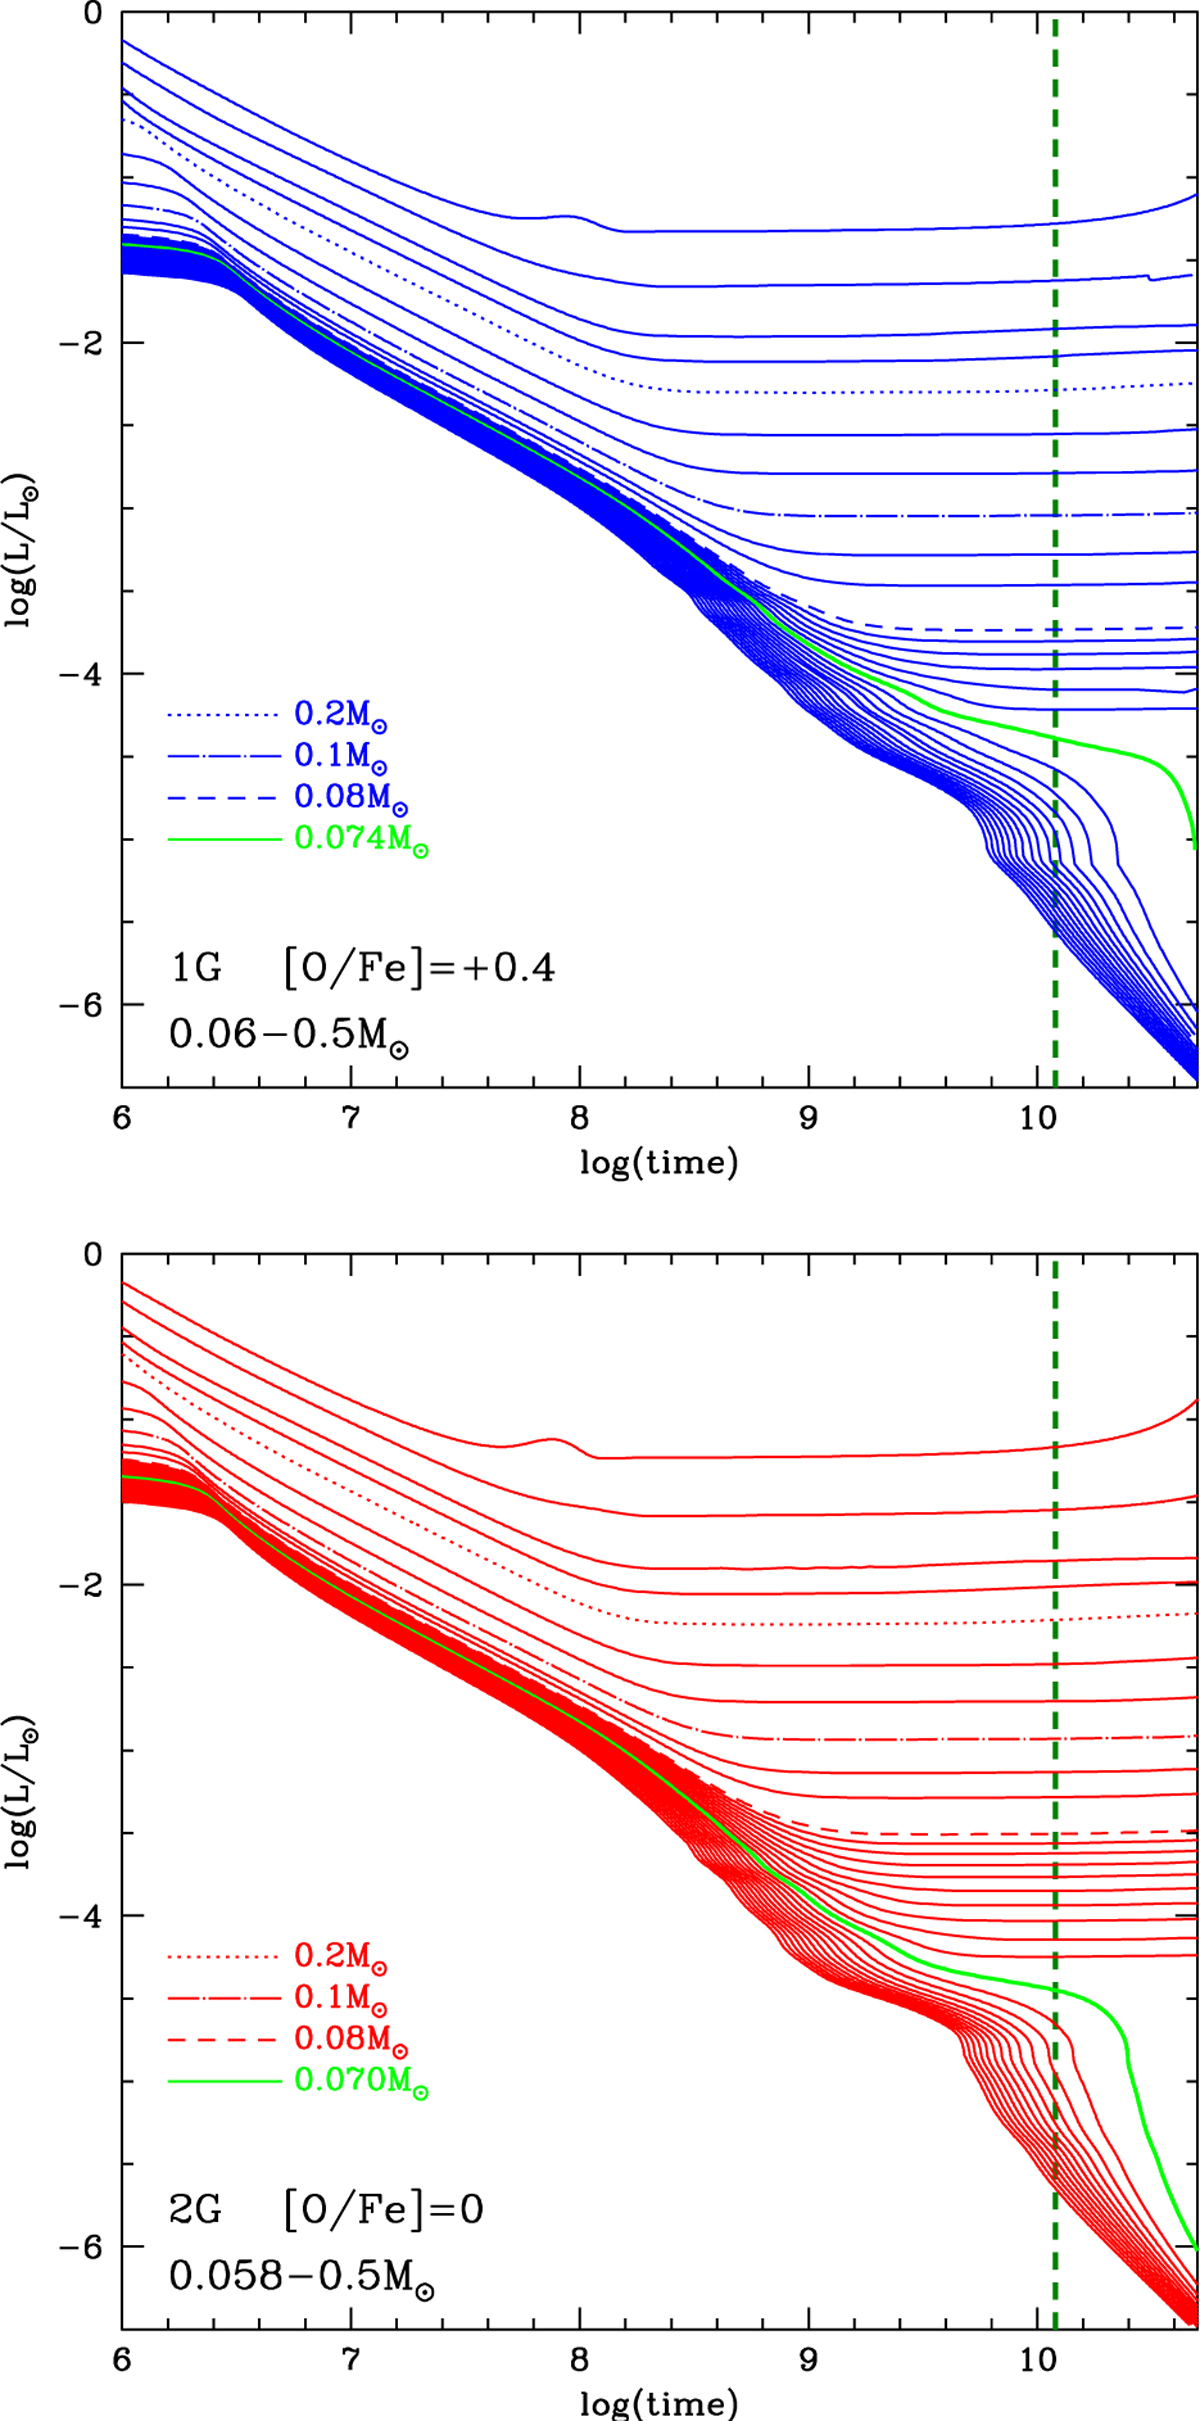
Fig. 2
Download original image
Time variation of the luminosity of stellar models calculated with the physical and chemical input described in Section 2. Stellar models representing the 1G and the 2G of the cluster are shown in the top and bottom panel, respectively. The dashed green line indicates the age of 12 Gyr. The tracks in green highlight the time evolution of the minimum mass supported by proton-proton chain luminosity at the age of 12 Gyr; namely, 0.074 M⊙ (top panel, 1G) and 0.070 M⊙ (bottom panel, 2G). The tracks of the stars of mass 0.2 M⊙ (dotted lines), 0.1 M⊙ (dash-dotted), and 0.08 M⊙ (dashed) are highlighted.
Current usage metrics show cumulative count of Article Views (full-text article views including HTML views, PDF and ePub downloads, according to the available data) and Abstracts Views on Vision4Press platform.
Data correspond to usage on the plateform after 2015. The current usage metrics is available 48-96 hours after online publication and is updated daily on week days.
Initial download of the metrics may take a while.