Fig. 4
Download original image
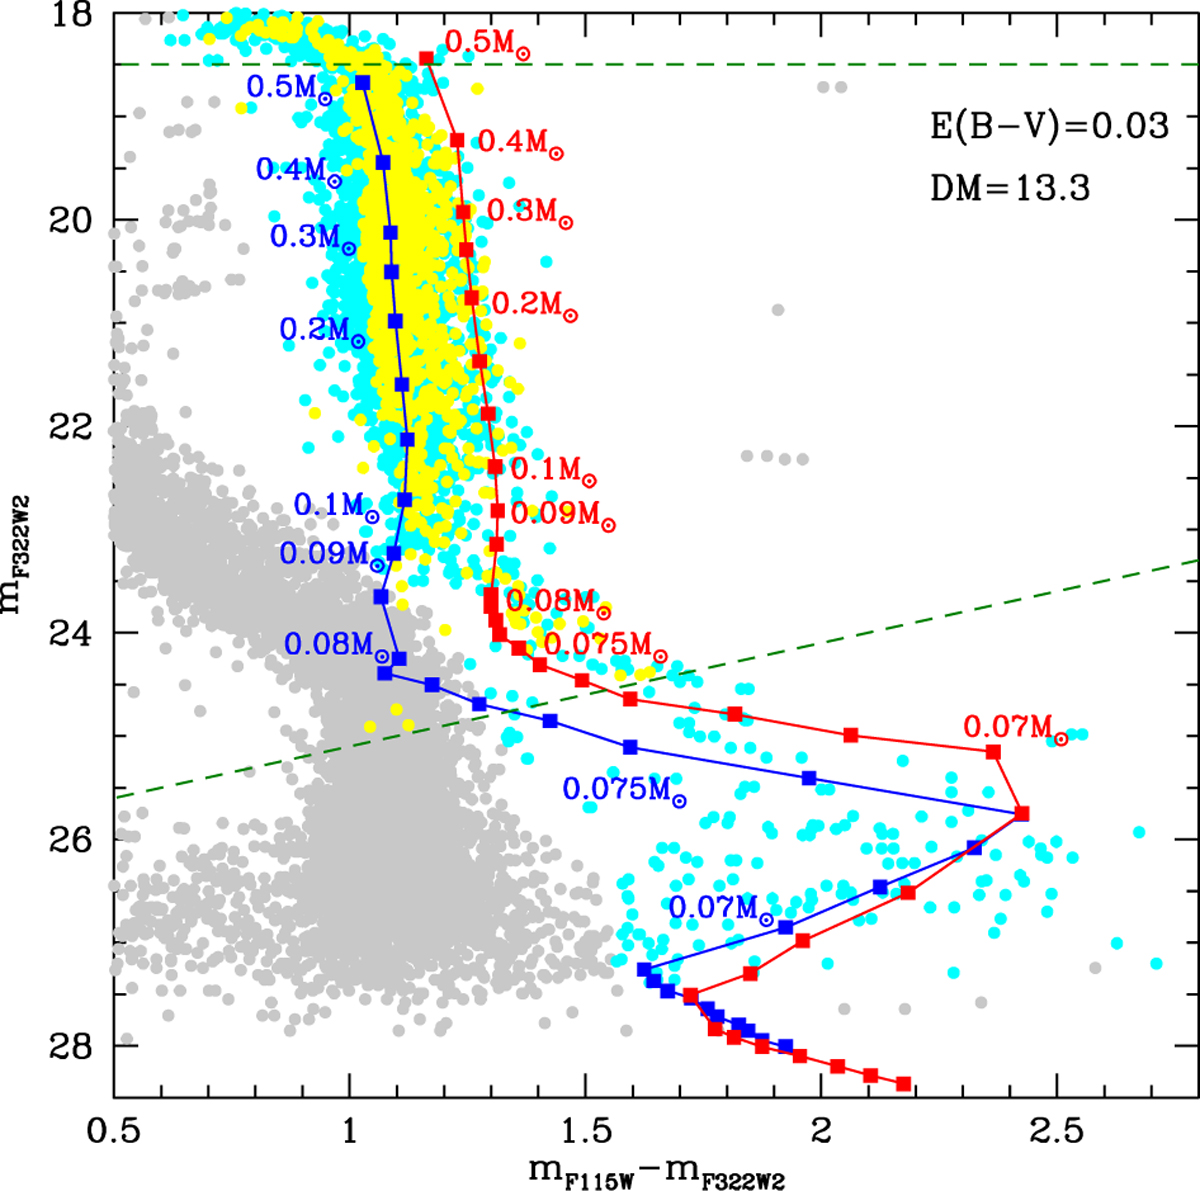
mF322W2 versus (mFn5W - mF322W2) colour-magnitude diagram of 47 Tuc stars from Milone et al. (2023) and MA24. Cyan dots indicate all sources observed for 47 Tuc, yellow dots indicate confirmed cluster members according to the criteria described in Section 3.3, and grey dots indicate SMC members. The blue and the red lines indicate 12 Gyr isochrones for the 1G and 2G of the cluster, respectively. Some specific masses are labelled along the isochrones. The masses 0.5,0.4,0.3,0.25,0.2,0.15,0.12,0.1,0.09,0.085,0.08 M⊙ are shown. Below 0.08 M⊙ the models are spaced by 0.001 M⊙ down to 0.06 M⊙ for the 1G and to 0.058 M⊙ for the 2G. Finally, the upper dashed green line represents the saturation limit (mF322W2 ≃ 18.5), while the lower diagonal green line indicates the limit where proper motions are available (mpn5w = 26.1 as in MA24, properly converted in mF322W2).
Current usage metrics show cumulative count of Article Views (full-text article views including HTML views, PDF and ePub downloads, according to the available data) and Abstracts Views on Vision4Press platform.
Data correspond to usage on the plateform after 2015. The current usage metrics is available 48-96 hours after online publication and is updated daily on week days.
Initial download of the metrics may take a while.