Fig. 5
Download original image
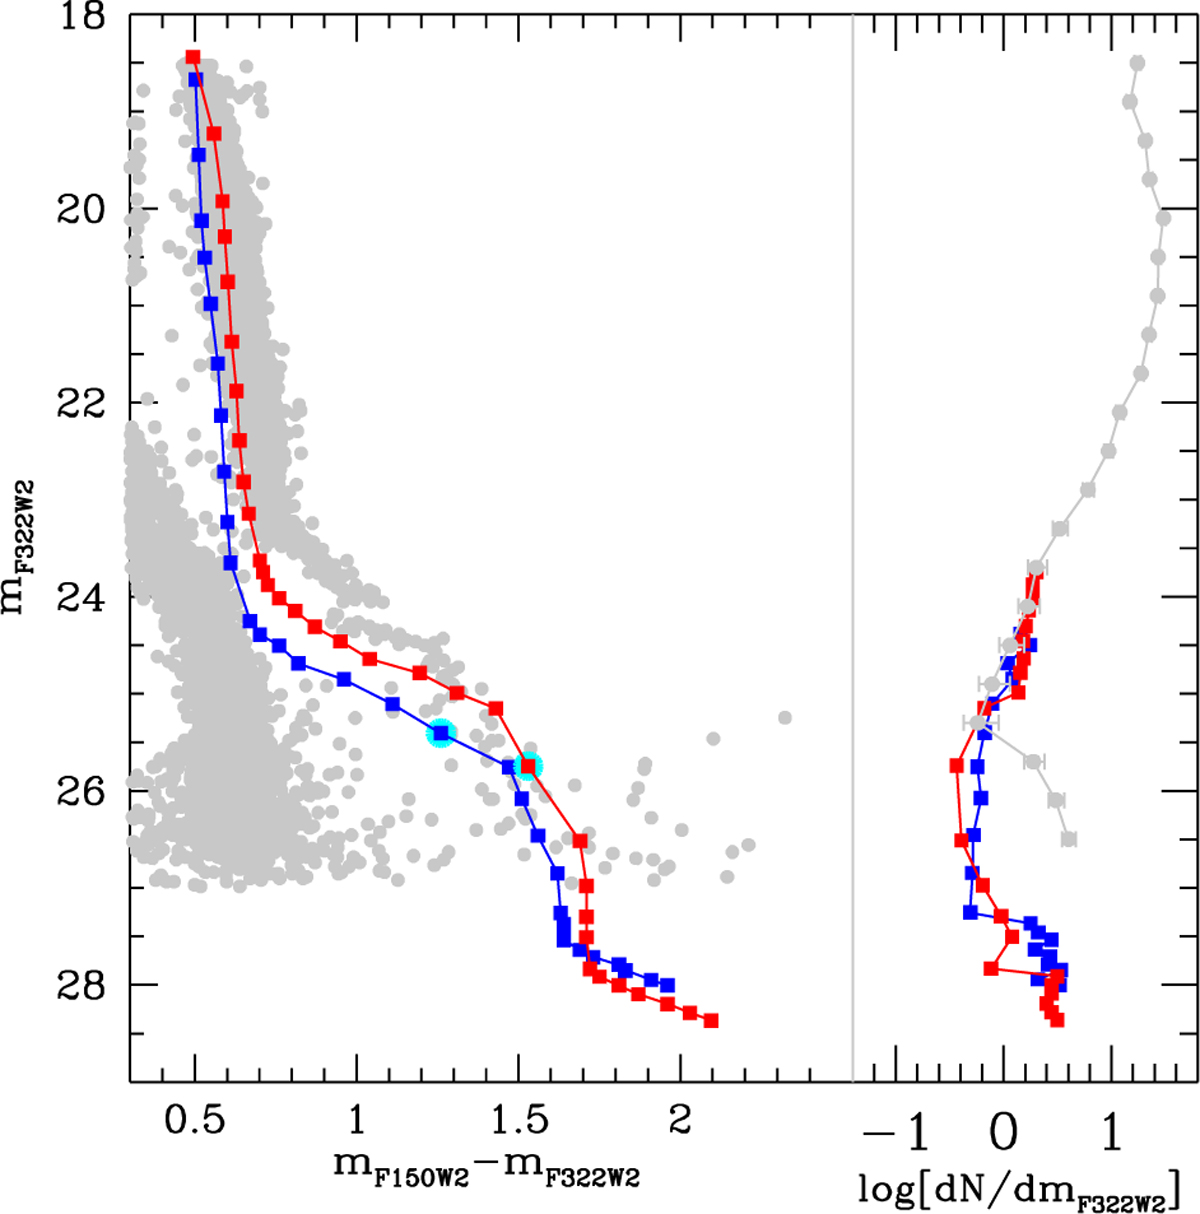
Colour-magnitude data in the (mF150W2 — mF322W2, mF322W2) plane (left, grey dots) are compared with the theoretical models. Contrary to the previous diagram, the agreement is unsatisfactory. These are the data from which the luminosity function was derived. The LF is shown in the right side of the figure (grey dots), together with the theoretical luminosity function obtained by assuming a flat MF below 0.3 M⊙, by normalising the mass luminosity derivative of the models to the data. The figure shows that the observational LF would be reproduced if the transition masses were more luminous than computed by about 1.5 mag.
Current usage metrics show cumulative count of Article Views (full-text article views including HTML views, PDF and ePub downloads, according to the available data) and Abstracts Views on Vision4Press platform.
Data correspond to usage on the plateform after 2015. The current usage metrics is available 48-96 hours after online publication and is updated daily on week days.
Initial download of the metrics may take a while.