Fig. 6
Download original image
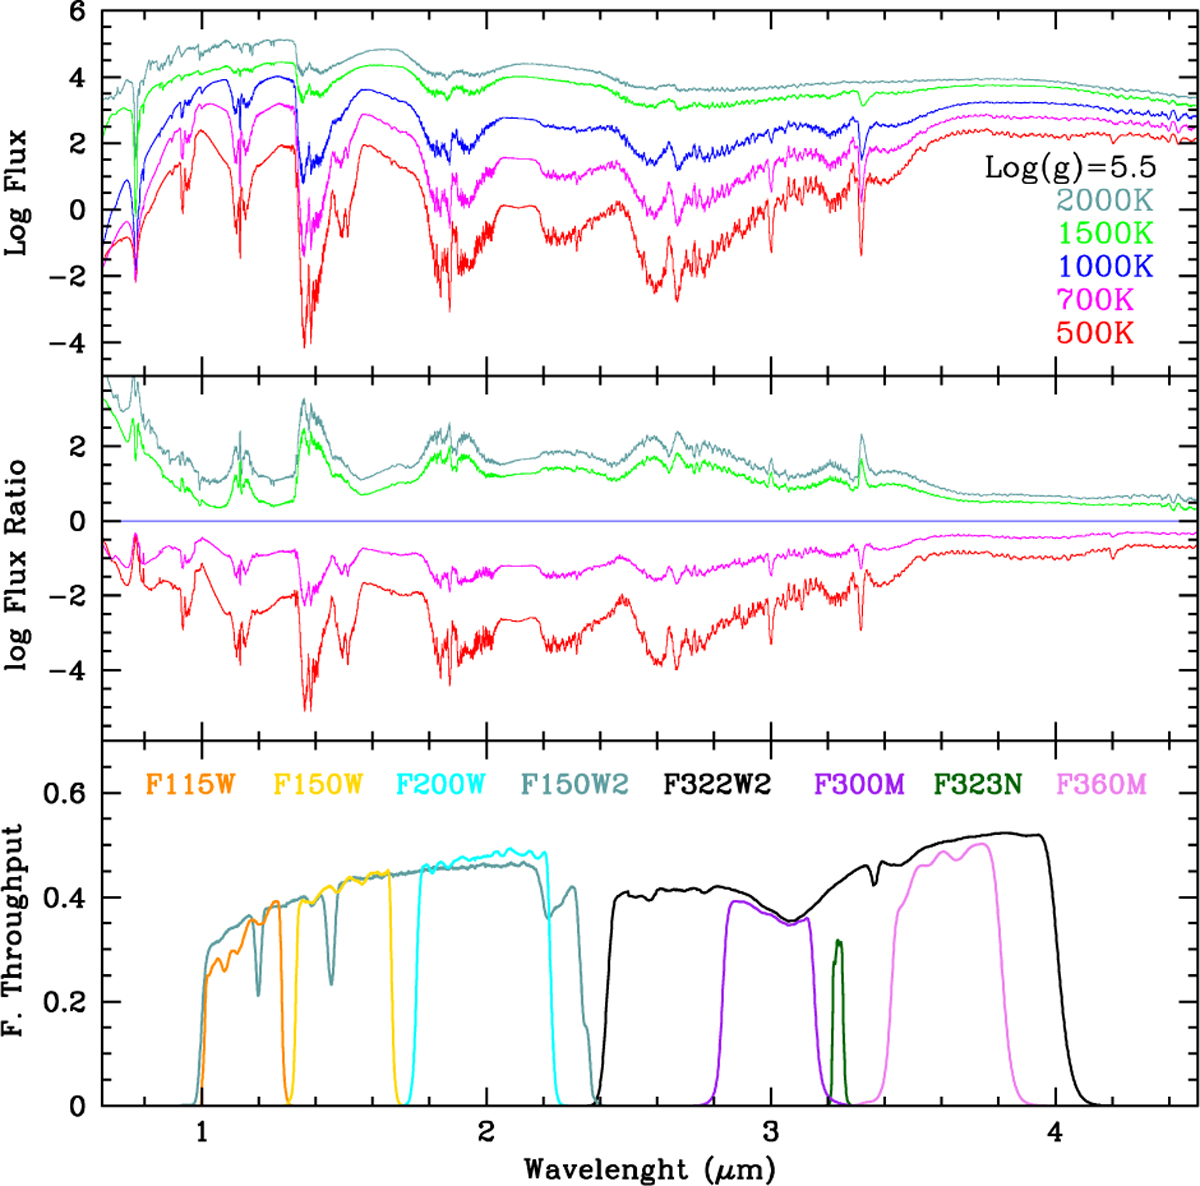
Top panel : synthetic spectra of various temperatures at the labelled gravity; their chemistry and elements distribution correspond to the 1G case. Middle panel : ratio between the spectra showed in the top panel and the one at 1000 K, taken as reference. Bottom panel : throughput of several JWSR filters that are important for the wavelength range of our data.
Current usage metrics show cumulative count of Article Views (full-text article views including HTML views, PDF and ePub downloads, according to the available data) and Abstracts Views on Vision4Press platform.
Data correspond to usage on the plateform after 2015. The current usage metrics is available 48-96 hours after online publication and is updated daily on week days.
Initial download of the metrics may take a while.