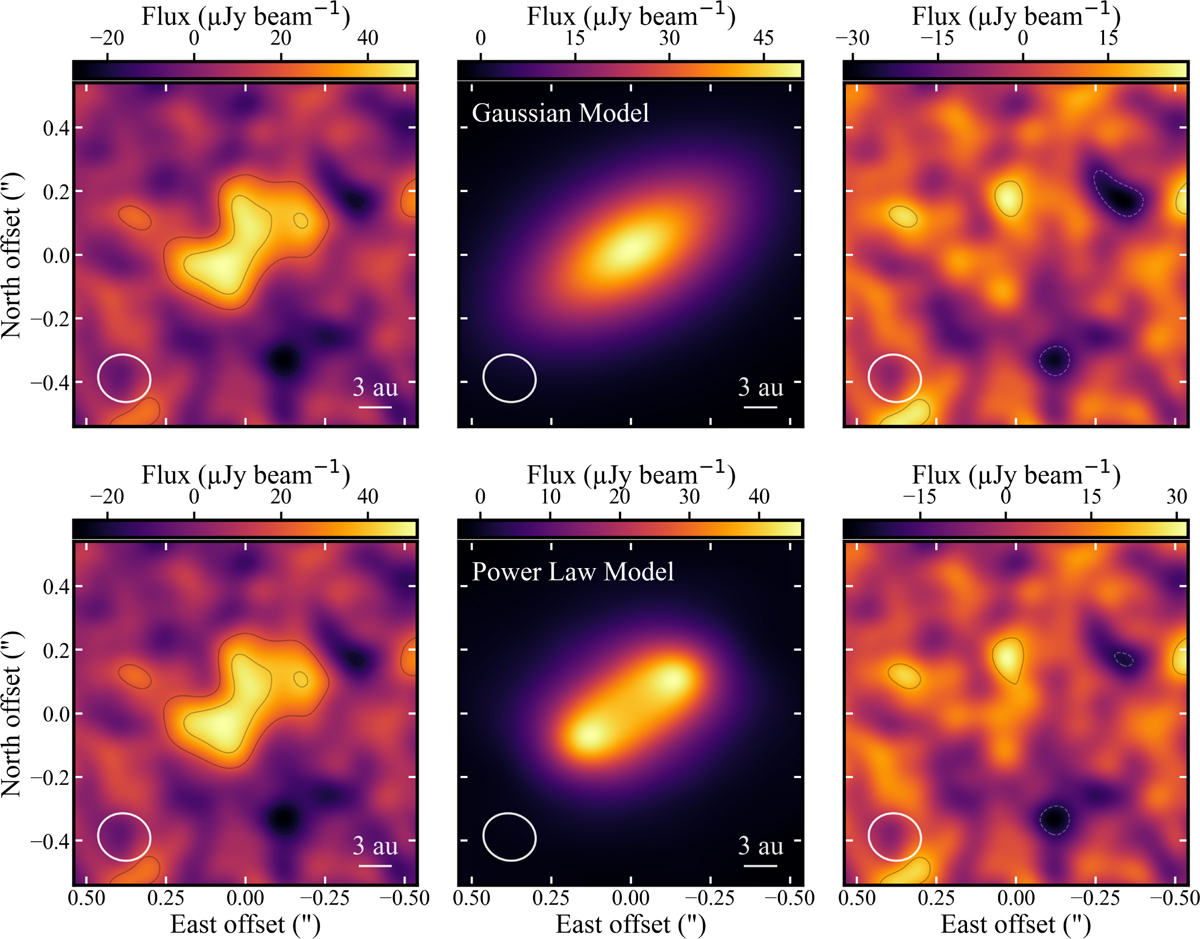
Fig. 2
Download original image
Left column: same as the right panel in Fig. 1. Middle column: disk-only models created using RADMC-3D and tclean with the best-fit values from the MCMC fitting (see Table 2), as described in Sect. 4.2. Right column: residuals from subtracting the model visibilities from the data visibilities, as described in Sect. 4.3. Top row: Gaussian model and residuals corresponding to that model. Bottom row: power-law model and residuals corresponding to that model. All panels are imaged using a natural weighting and a u-v taper, as described in Sect. 2, and the contours are ±[2, 4, 6] × 10.4 µJy beam−1, the RMS noise level.
Current usage metrics show cumulative count of Article Views (full-text article views including HTML views, PDF and ePub downloads, according to the available data) and Abstracts Views on Vision4Press platform.
Data correspond to usage on the plateform after 2015. The current usage metrics is available 48-96 hours after online publication and is updated daily on week days.
Initial download of the metrics may take a while.