Fig. 10
Download original image
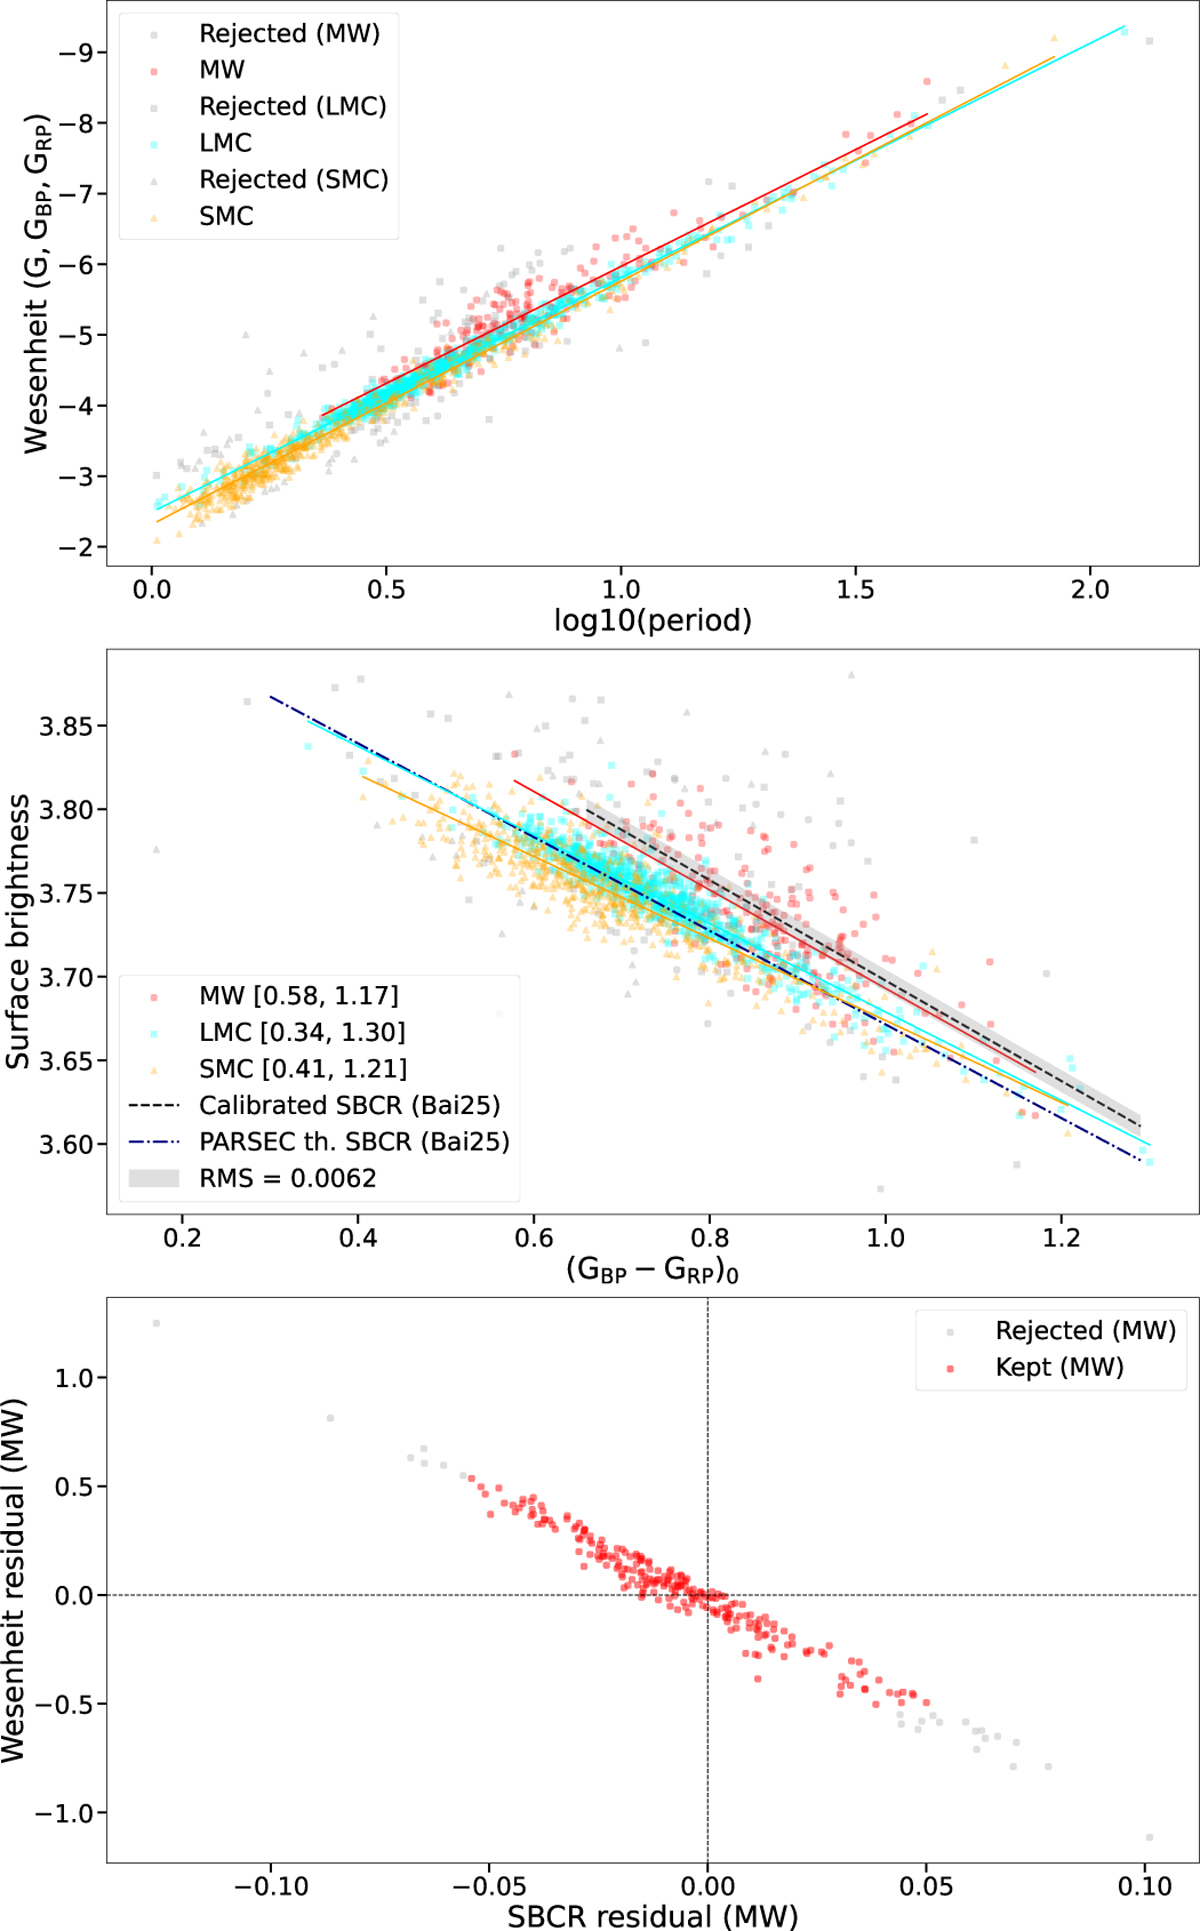
Top: absolute period–Wesenheit (PW) relations for DCEP and FUNDAMENTAL MW, LMC, and SMC Cepheids. Middle: SBCRs using the Gaia GBP and GRP bands. The colour range is indicated in the legend. Bottom: relation between the PW fit residual and the SBCR residual relative to the calibrated SBCR represented by the dotted black line in the middle panel (only for MW Cepheids).
Current usage metrics show cumulative count of Article Views (full-text article views including HTML views, PDF and ePub downloads, according to the available data) and Abstracts Views on Vision4Press platform.
Data correspond to usage on the plateform after 2015. The current usage metrics is available 48-96 hours after online publication and is updated daily on week days.
Initial download of the metrics may take a while.