Fig. 1.
Download original image
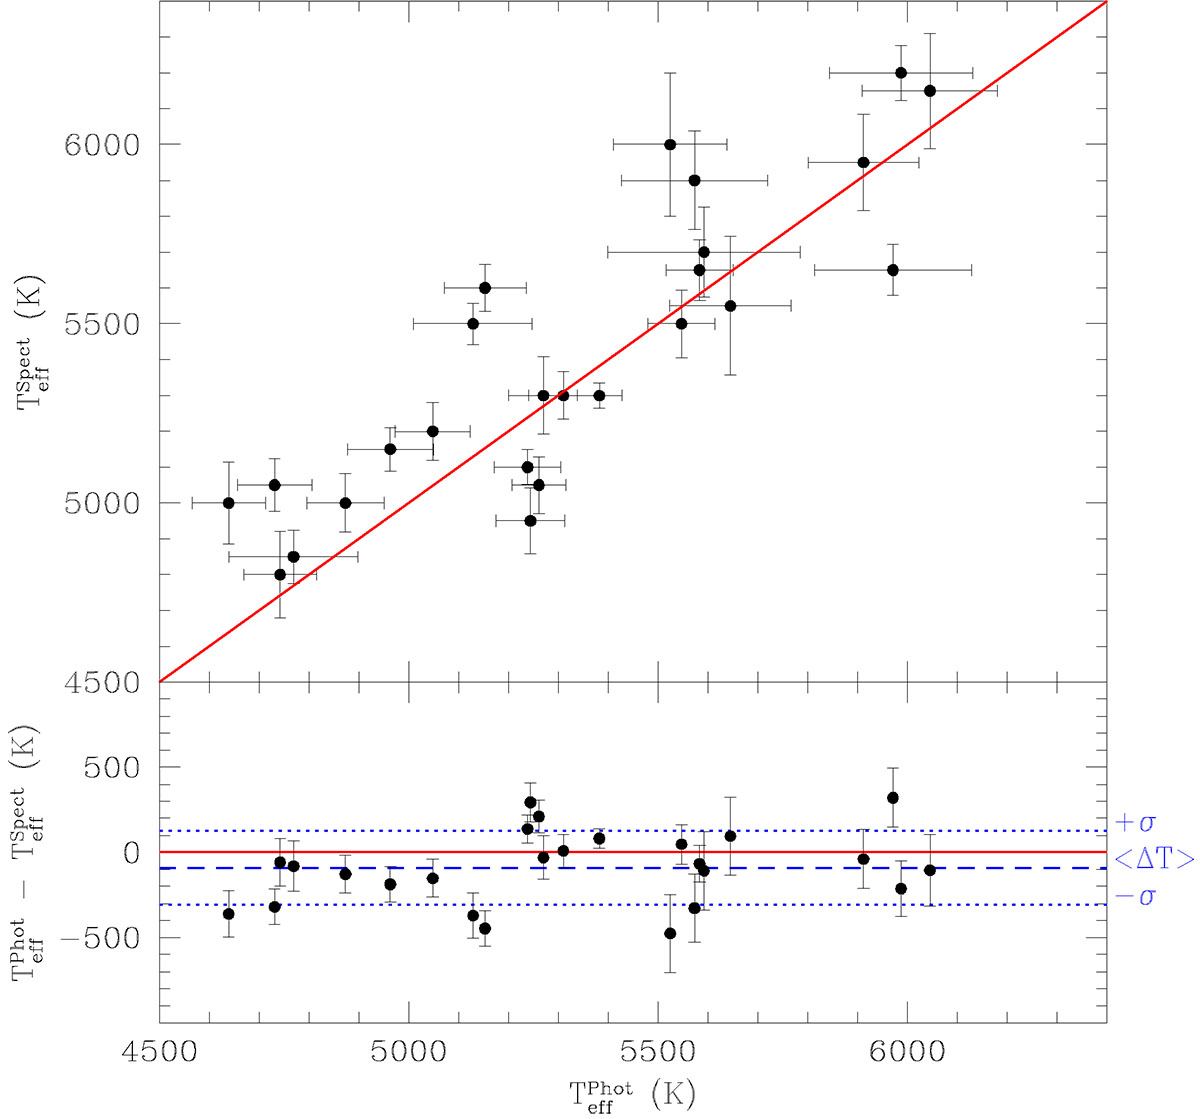
Upper panel: comparison between effective temperatures derived from spectroscopy and photometry. The solid red solid represents the bisecting line. Bottom panel: residuals, computed as ![]() . They show a mean offset of −90 ± 200 K. The solid red line represents the null difference (ΔTeff = 0), and the dashed blue line shows the mean residual (−90 K). The region of ±1σ scatter is delimited by dotted blue lines.
. They show a mean offset of −90 ± 200 K. The solid red line represents the null difference (ΔTeff = 0), and the dashed blue line shows the mean residual (−90 K). The region of ±1σ scatter is delimited by dotted blue lines.
Current usage metrics show cumulative count of Article Views (full-text article views including HTML views, PDF and ePub downloads, according to the available data) and Abstracts Views on Vision4Press platform.
Data correspond to usage on the plateform after 2015. The current usage metrics is available 48-96 hours after online publication and is updated daily on week days.
Initial download of the metrics may take a while.