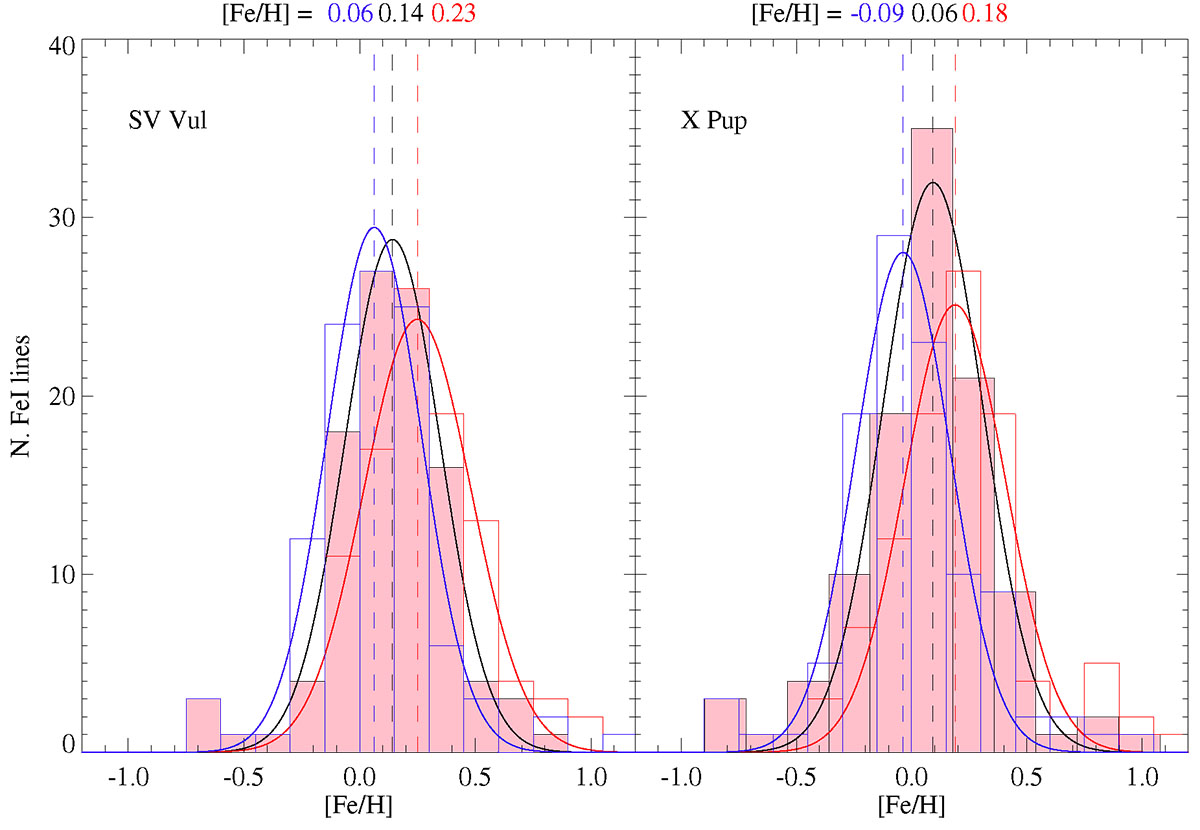
Fig. 4.
Download original image
Effect of microturbulent velocity on the derived FeI abundances for two representative stars in the sample, SV Vul and X Pup. Each panel shows the abundance distributions obtained by adopting three different values of ξ: 3.3 km s−1 (pink histogram with the black Gaussian fit), 2.3 km s−1 (red), and 4.3 km s−1 (blue). In all cases, the resulting differences are smaller than 0.1 dex and lie within the typical abundance uncertainties, supporting the robustness of using a fixed ξ in our analysis.
Current usage metrics show cumulative count of Article Views (full-text article views including HTML views, PDF and ePub downloads, according to the available data) and Abstracts Views on Vision4Press platform.
Data correspond to usage on the plateform after 2015. The current usage metrics is available 48-96 hours after online publication and is updated daily on week days.
Initial download of the metrics may take a while.