Fig. 5.
Download original image
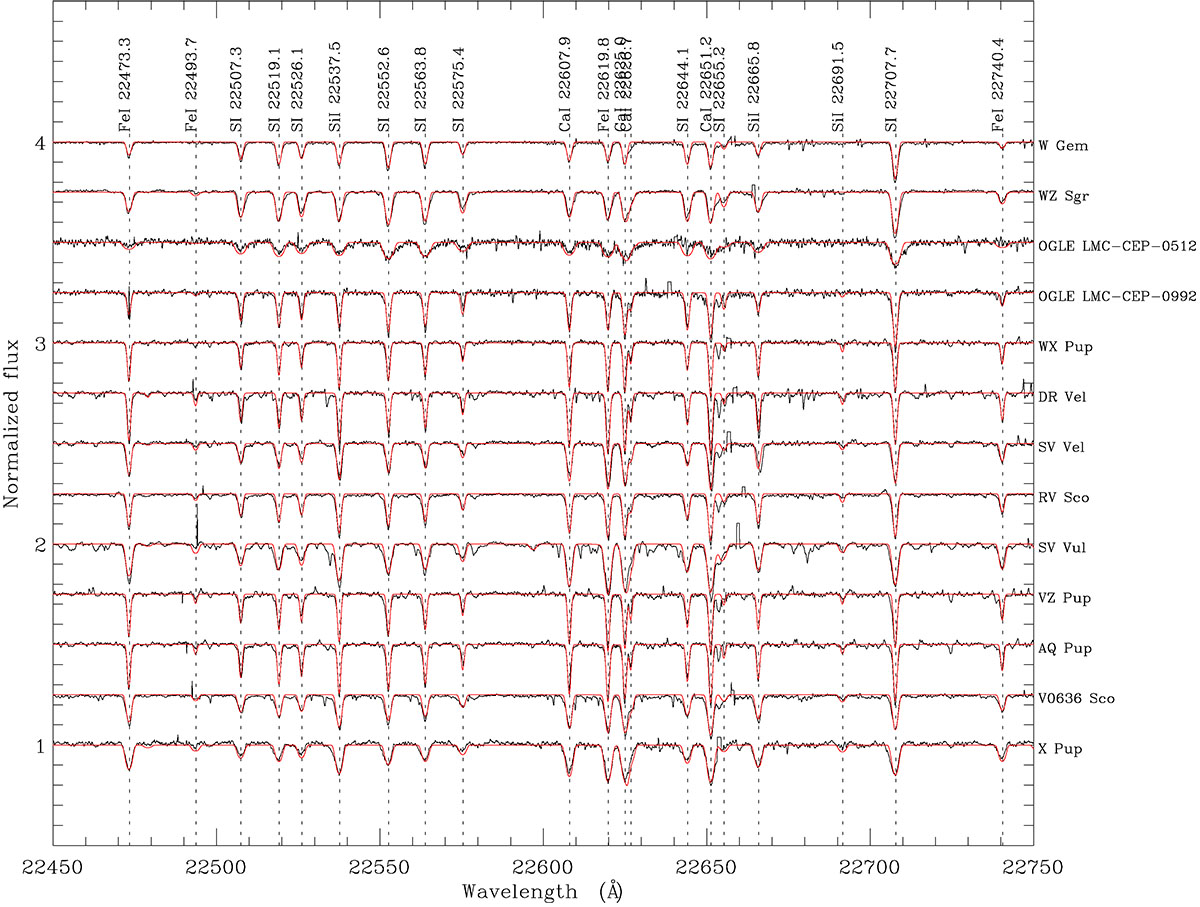
Representative subsample of 13 observed spectra (black) in the region between λ = 22 450 and 22 750 Å. The best-fitting synthetic spectra are overplotted in red. The spectra are ordered from top to bottom by decreasing effective temperature (see Table 2). The main spectral lines are identified at the top and are highlighted with dotted vertical black lines.
Current usage metrics show cumulative count of Article Views (full-text article views including HTML views, PDF and ePub downloads, according to the available data) and Abstracts Views on Vision4Press platform.
Data correspond to usage on the plateform after 2015. The current usage metrics is available 48-96 hours after online publication and is updated daily on week days.
Initial download of the metrics may take a while.