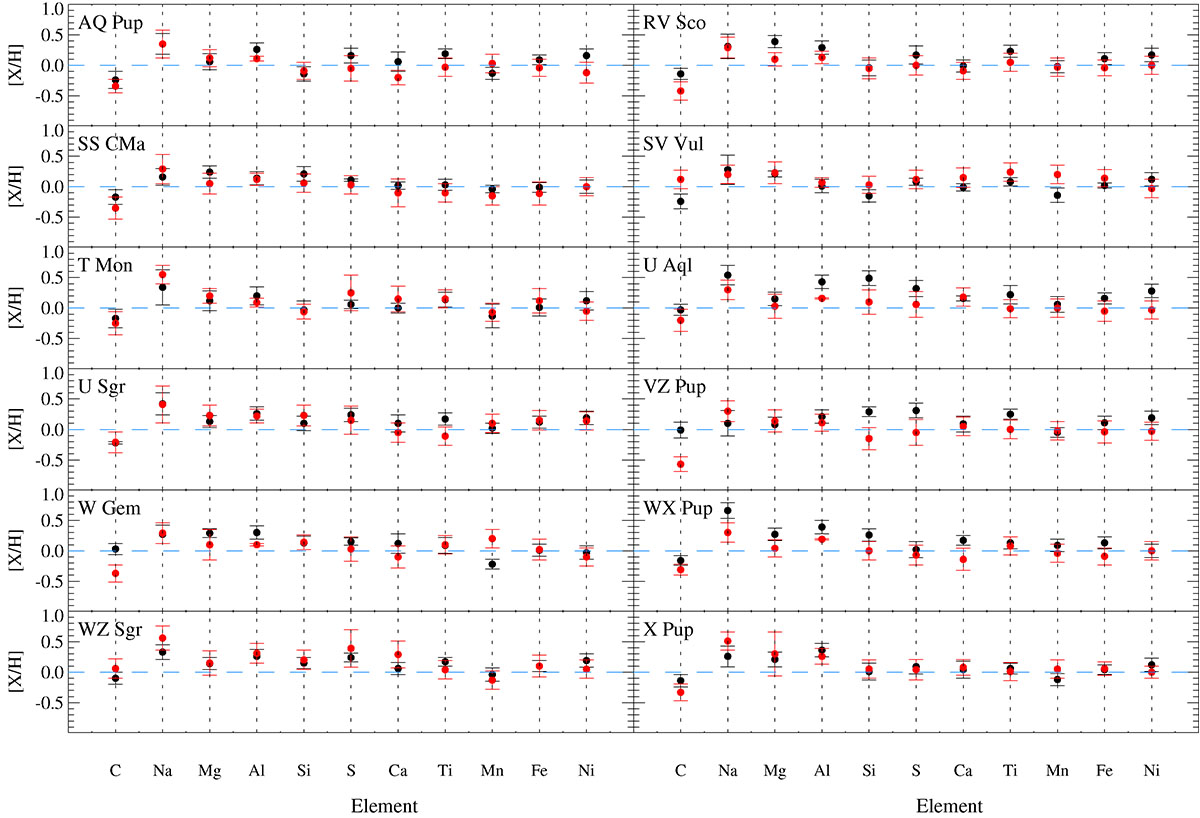
Fig. 8.
Download original image
Differences between elemental species (on the x-axis) derived in this work from near-infrared IGRINS spectra (black dots) and those published by T24 using optical high-resolution spectra obtained with ESPaDOnS at the CFHT (red dots). On the y-axis, the difference is expressed in the [X/H] form. Each panel corresponds to a star in common in the two samples.
Current usage metrics show cumulative count of Article Views (full-text article views including HTML views, PDF and ePub downloads, according to the available data) and Abstracts Views on Vision4Press platform.
Data correspond to usage on the plateform after 2015. The current usage metrics is available 48-96 hours after online publication and is updated daily on week days.
Initial download of the metrics may take a while.