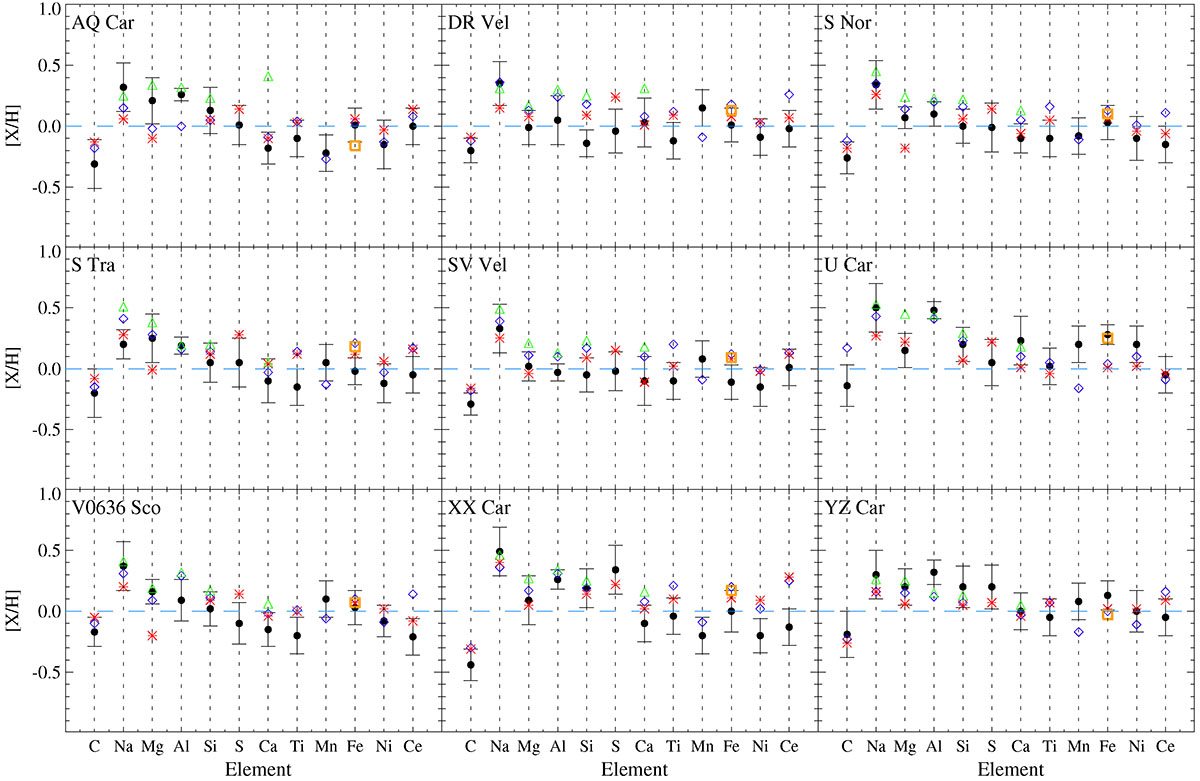
Fig. 9.
Download original image
Comparison between elemental abundances derived in this work from IGRINS near-infrared spectra (black circles) and values available in the literature for the same stars. The red asterisks correspond to Luck et al. (2011), blue diamonds to Luck & Lambert (2011), orange squares to Genovali et al. (2014), and green triangles to Genovali et al. (2015). The dashed horizontal blue line marks the null difference.
Current usage metrics show cumulative count of Article Views (full-text article views including HTML views, PDF and ePub downloads, according to the available data) and Abstracts Views on Vision4Press platform.
Data correspond to usage on the plateform after 2015. The current usage metrics is available 48-96 hours after online publication and is updated daily on week days.
Initial download of the metrics may take a while.