Fig. 3
Download original image
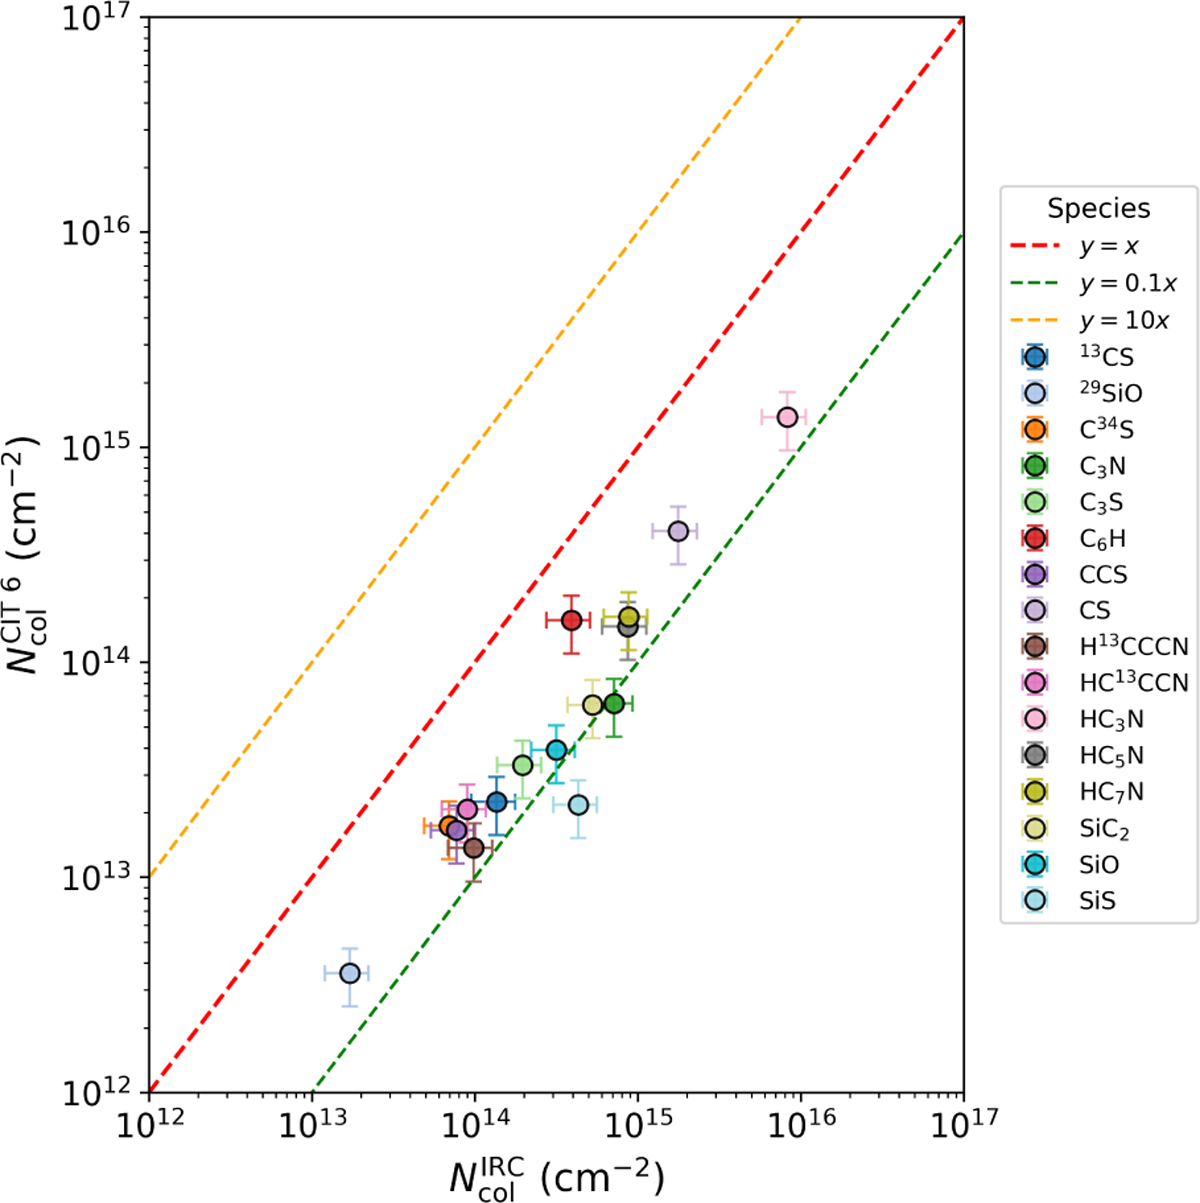
Comparison of molecular column densities in CIT 6 and IRC+10216 derived from our survey data. The dashed red line marks the one-to-one relation, where both sources have equal column densities. The dashed yellow line indicates where column densities in CIT 6 are two times lower than in IRC+10216, while the dashed green line shows the case where column densities in CIT 6 are ten times lower. Most species are less abundant in CIT 6 by factors of 2-10, while a few (e.g. SiO) show comparable column densities. A detailed breakdown of relative abundances with respect to HC3N, C34S, and SiO is provided in Table 7 and 8.
Current usage metrics show cumulative count of Article Views (full-text article views including HTML views, PDF and ePub downloads, according to the available data) and Abstracts Views on Vision4Press platform.
Data correspond to usage on the plateform after 2015. The current usage metrics is available 48-96 hours after online publication and is updated daily on week days.
Initial download of the metrics may take a while.