| Issue |
A&A
Volume 706, February 2026
|
|
|---|---|---|
| Article Number | A127 | |
| Number of page(s) | 12 | |
| Section | Interstellar and circumstellar matter | |
| DOI | https://doi.org/10.1051/0004-6361/202558033 | |
| Published online | 09 February 2026 | |
A spectral-line survey of CIT 6 between 30 and 50 GHz with the eQ receiver at NRO 45 m
1
Université Paris-Saclay, Université Paris Cité, CEA, CNRS,
AIM,
91191
Gif-sur-Yvette,
France
2
Simons Astrophysics Group at ICISE, Institute for Interdisciplinary Research in Science and Education (IFIRSE), ICISE,
07 Science Avenue, Quy Nhon Nam,
Gia Lai,
Vietnam
3
Institute for Astronomy and Space Quantum Communications (IAS),
Vietnam
4
National Astronomical Observatory of Japan (NAOJ), National Institutes of Natural Sciences (NINS),
2-21-1 Osawa,
Mitaka,
Tokyo
181-8588,
Japan
5
Graduate Institute for Advanced Studies, SOKENDAI,
2-21-1 Osawa, Mitaka,
Tokyo
181-8588,
Japan
6
Department of Astronomy, The University of Tokyo, Hongo,
Tokyo
113-0033,
Japan
7
Institute of Physics, Vietnam Academy of Science and Technology,
10 Dao Tan, Giang Vo,
Hanoi,
Vietnam
8
Institute of Astronomy and Astrophysics, Academia Sinica, 11F of Astronomy-Mathematics Building, National Taiwan University,
No. 1, Sec., Roosevelt Road,
Taipei
10617,
Taiwan
9
Faculty of Social Information Studies, Otsuma Women’s University, Chiyoda-ku,
Tokyo
102-8357,
Japan
10
Department of Astronomy and Earth Sciences, Tokyo Gakugei University,
4-1-1 Nukuikitamachi, Koganei,
Tokyo
184-8501,
Japan
11
Center for Astronomy, Ibaraki University,
2-1-1 Bunkyo, Mito,
Ibaraki
310-8512,
Japan
12
Nobeyama Radio Observatory, National Astronomical Observatory of Japan (NAOJ), National Institutes of Natural Sciences (NINS),
462-2 Nobeyama, Minamimaki, Minamisaku,
Nagano
384-1305,
Japan
13
Department of Physics, Graduate School of Science, Osaka Metropolitan University,
1-1 Gakuen-cho, Naka-ku, Sakai,
Osaka
599-8531,
Japan
14
Institute of Astronomy, National Tsing Hua University,
No. 101, Section 2, Kuang-Fu Road,
Hsinchu
30013,
Taiwan
15
The American University of Paris,
2bis, Passage Landrieu,
75007
Paris,
France
16
Center for Space Technology Research and Development, Vietnam National Space Center,
Hanoi,
Vietnam
★ Corresponding author: This email address is being protected from spambots. You need JavaScript enabled to view it.
Received:
8
November
2025
Accepted:
12
December
2025
Abstract
Context. At the end of the long H-burning phase (main sequence), low-mass to intermediate-mass stars evolve into asymptotic giant branch (AGB) stars that can have carbon-rich envelopes depending on the initial C/O ratio. In their circumstellar envelopes (CSEs), dust particles and molecules are formed and shed back to the interstellar space. Therefore, these stars significantly contribute to the galactic astro-chemical evolution.
Aims. To shed light on the chemical properties of carbon-rich CSEs, especially carbon- and silicon-bearing molecules, we performed parallel spectral-line surveys of IRC+10216 and CIT 6, the brightest and second-brightest carbon-rich star envelopes on the sky.
Methods. We conducted 30−50 GHz observations towards both sources using a high-sensitivity-wide-band extended Q-band receiver (eQ) of the Nobeyama 45−m telescope. We then analysed data of CIT 6 and used data of IRC+10216 for comparison purposes. We applied the rotational-diagram method to derive their rotational temperatures and column densities for HC5N and HC7N. For other molecules, we assumed an excitation temperature to derive their column densities.
Results. Molecular column densities in CIT 6 are systematically lower than those of IRC+10216, typically by one order of magnitude. Silicon- and sulfur-bearing species such as SiS and CS show the strongest depletion, whereas carbon-chain molecules (HCnN, C6H) remain relatively prominent, indicating that carbon-chain formation is still efficient in CIT 6. Rotational temperatures are higher in CIT 6, which is consistent with the fact that emission arises from warmer and more compact regions of its envelope. Both sources show low 12C/13C ratios and mildly sub-solar 28Si/29Si values, which are non-solar isotopic ratios.
Conclusions. Both envelopes display canonical, carbon-rich AGB chemistry and comparable isotopic compositions. CIT 6, however, shows slightly higher excitation temperatures, stronger carbon-chain growth, and deeper depletion of Si- and S-bearing species. These signatures point to a more evolved circumstellar environment, where dust condensation and shock processing further modulated the molecular composition.
Key words: stars: AGB and post-AGB / stars: carbon / ISM: lines and bands / ISM: molecules / planetary nebulae: general / planetary nebulae: individual: CIT 6
© The Authors 2026
 Open Access article, published by EDP Sciences, under the terms of the Creative Commons Attribution License (https://creativecommons.org/licenses/by/4.0), which permits unrestricted use, distribution, and reproduction in any medium, provided the original work is properly cited.
This article is published in open access under the Subscribe to Open model. This email address is being protected from spambots. You need JavaScript enabled to view it. to support open access publication.
1 Introduction
A carbon star has an atmosphere with a higher abundance of carbon compared to oxygen (Wallerstein & Knapp 1998). It represents the final phase of low-mass to intermediate-mass main-sequence stars (masses of 0.8−8 M⊙). Typically, in the late stages of their evolution, carbon stars have exhausted most of their nuclear fuel. They lose mass through strong stellar winds, creating a circumstellar envelope (CSE) of gas and dust. They produce carbon and other heavy elements, which are expelled into the interstellar medium through these stellar winds (Jura 1986; Dinh-V-Trung & Lim 2008; Hirano et al. 2005), contributing to its enrichment. Understanding the chemical compositions in CSEs is also important for studying the chemical evolution of interstellar gas in our Galaxy (Hirano et al. 2004; Dinh-V-Trung et al. 2022).
Among all carbon stars, IRC+10216 (also named CW Leonis, IRAS 09452+1330, RAFGL 1381, and the Peanut Nebula) is the brightest source at near-infrared wavelengths (Ulrich et al. 1966; He et al. 2008, 2017). It is located at a distance of 123 ± 14 pc (Groenewegen et al. 1998, 2012) from the Sun. It is believed to be in a late stage of its life, blowing off its own sooty atmosphere to eventually form a white dwarf (Patel et al. 2009; Ladjal et al. 2010). On the other hand, CIT 6 (also named RW Leonis Minoris, GL 403, IRC+30219, and IRAS 10131+3049) is the second-brightest carbon star (Ulrich et al. 1966; Dinh-V.-Trung & Lim 2009; Zhang et al. 2009b). Its distance from the Sun is 400 ± 50 pc (Cohen & Hitchon 1996). CIT 6 is thought to be a binary as a result of detailed observations and simulations of its spiral structures (Kim et al. 2013, 2015).
These stars have rather different diameters, masses, temperatures, and luminosities; hence, they exhibit different spectroscopic features, especially at millimetre wavelengths (see Table 2). For example, the rotational lines of SiO and SiC2 show double-peaked profiles in IRC+10216, whereas they show a broad, single, asymmetric peak feature in CIT 6. Hubble Space Telescope observations of CIT 6 revealed that a bipolar structure, frequently seen in protoplanetary nebulae (pPNs), has developed in the innermost region of the CSE (Schmidt et al. 2002). CIT 6 is therefore in the transitional phase from the asymptotic giant branch (AGB) to the planetary nebula stage.
Both stars exhibit semi-periodic variability with periods of 640 days for IRC+10216 and 630 days for CIT 6, respectively (Alksnis & Khozov 1975; Whitelock et al. 2006). The significant mass-loss rates are measured to be 1.1 × 10⁻⁵ and 2.2 × 10⁻⁵ M⊙ yr−1 for CIT 6 and IRC+10216, respectively (De Beck et al. 2012; Dinh-V.-Trung & Lim 2009; Whitelock et al. 2006).
In this paper, we present the results of a spectral-line survey of carbon stars in the Q band (30−50 GHz) toward CIT 6 and IRC+10216. This band includes numerous transitions of carbonrich species such as cyanopolyynes and carbon-chain radicals (Taniguchi et al. 2024b,a), making it well suited for revealing the physical and chemical properties of cool CSEs. Previous spectral-line surveys of carbon stars primarily focused on the brightest carbon star, IRC+10216. For example, Kawaguchi et al. (1995) conducted a survey in the 28−50 GHz range using the Nobeyama 45 m telescope, identifying 188 lines with a noise level of ∼ 10 mK in  at a 250 kHz resolution. More recently, Tercero et al. (2021) and Pardo et al. (2022) performed a deep spectral-line survey with the Yebes 40 m telescope, identifying 713 transition lines in the 31.0−50.3 GHz range with an excellent noise level of ∼ 1 mK at a comparable frequency resolution, thereby detecting many more lines.
We used a newly developed 30−50 GHz band extended-Q band receiver (eQ) (Chiong et al. 2022; Nakamura et al. 2024), which has excellent sensitivity and wide bandwidth, installed at the Nobeyama 45−m telescope. A previous line survey towards CIT 6 in a similar frequency range was conducted by Chau et al. (2012) with the Nobeyama 45 m telescope, but they only covered a limited frequency range in the Q band (36−38.5 GHz, 39.5− 40.5 GHz, and 41.5−50 GHz). They detected 25 spectral lines of five molecular species (HC3N, HC5N, HC7N, SiO, and CS). Their results suggest that cyanopolyynes are enhanced similarly to IRC+10216. The obtained lines sometimes show asymmetric shapes, consistent with the high-resolution observations by Dinh-V-Trung & Lim (2008); Kim et al. (2015), which also revealed a spiral structure in the CSE of CIT 6. More recently, Yang et al. (2023) conducted a 3 mm(90−116 GHz) survey towards CIT 6 and detected 42 emission lines for ten molecular species and four isotopologues. For comparison, the previous line surveys towards CIT 6 are summarised in Table 1.
Here, we present the first complete spectral survey of CIT 6 in the 30−50 GHz range in order to compare the chemical properties of the CSEs of IRC+10216 and CIT 6. We describe the details of the observations in Sect. 2. The results are presented in Sect. 3 and the discussions are given in Sect. 4. Finally, we summarize our conclusions in Sect. 5.
Summary of this and previous line surveys toward CIT 6.
2 Observation
In March 2024, we observed two carbon-rich stars, CIT 6 and IRC+10216, using the NRO 45 m telescope equipped with the eQ receiver (Nakamura et al. 2024) and the SAM45 FX-type spectrometer (see Table 4). Observations were conducted in positionswitching mode, with the emission-free reference position located +30′ away from the target in right ascension. To cover the 30−50 GHz frequency range, we used six different frequency settings, each covering (0.4 GHz × 8=) 3.2 GHz with a frequency resolution of 120 kHz and a bandwidth of 500 MHz. The velocity resolution ranges from 0.7 km s−1 at 50 GHz to 1.2 km s−1 at 30 GHz. For the final data product, we binned two channels, resulting in a spectral resolution of 240 kHz. During the observation season, only eight arrays of the SAM45 spectrometer were available for the eQ receiver. The beam size (HPBW) is 37′′ at 43 GHz, which corresponds to 0.022 pc and 0.056 pc at the distances of IRC+10216 and CIT 6, respectively. The main-beam efficiency was 0.73 at 43 GHz. The typical system temperature Tsys during the observations was in the range of 100−200 K (at frequencies above 40 GHz) and 50−80 K (at frequencies below 40 GHz). The telescope pointing was checked every 1.5 hours by observing the SiO maser line (J = 1−0, v = 1 and v = 2) from R Leo, maintaining a pointing accuracy within 3−5′′. The total observation time for one frequency setting was around two hours for the position-switch observations. The on-source integration time of each setting was about 40 min. The rms noise levels are 3.8−10.7 mK in IRC+10216 and 3.6−21.0 mK in CIT 6 at 30− 38 GHz, respectively, due to higher system noise temperatures at the upper end of the band (see Table 3 for more details).
For all calculations in Sect. 3.1 for CIT 6, we converted the antenna temperature  to the source brightness temperature TS and corrected for beam dilution as follows:
 (1)
(1)
where η = 0.74 is the average main-beam efficiency, which slightly increases to 0.75 at 33 GHz and decreases to 0.73 at 45 GHz (Nakamura et al. 2024). θb, the HPBW of the beam, is 38′′ at 43 GHz and scales linearly with frequency v as
 (2)
(2)
The average source diameter of CIT 6, θs, is about 20′′, as revealed by interferometric mapping with the Sub-millimetre Array (SMA) (Kim et al. 2015), and that of IRC+10216 is about 45′′, as mapped by the Atacama Large Millimetre Array (ALMA) (Agúndez et al. 2017). The correction factor increases from ∼ 8 at 30 GHz to ∼ 4 at 50 GHz, showing that the apparent line brightness of CIT 6 would be underestimated by roughly one order of magnitude at the low-frequency end if no correction was applied. For IRC+10216, however, the molecular envelope is comparable to or larger than the beam across the band, so only the main-beam efficiency correction is required. Note that the difference in beam filling factor may still bias relative abundance ratios slightly (by < 20%), but this is within our stated uncertainties and does not affect the qualitative conclusion that molecular lines in CIT 6 are systematically weaker than in IRC+10216.
Basic properties of CIT 6 and IRC+10216.
Noise levels of CIT 6 and IRC+10216 data.
Summary of observations.
3 Results and analysis
3.1 Detected lines in CIT 6
Figure 1 presents the complete spectra towards CIT 6 and IRC+10216, while Appendix B shows zoomed-in views of spectra in 1 GHz segments. IRC+10216 spectra are included solely for visual comparison; no line characterisation was performed for this source. Our IRC+10216 spectra are consistent with those reported by Kawaguchi et al. (1995) and Pardo et al. (2022).
Thanks to the high sensitivity (0.2−0.6 mK per MHz), high spectral resolution (0.229 MHz), and full coverage of the 31.0− 50.3 GHz band of the IRC+10216 survey of Pardo et al. (2022), we used their detected line list to identify our detected lines beside using the Splatalogue line catalogue (Remijan et al. 2007). We identify 42 lines above the 3σ level at the line peak in the CIT 6 spectra (Table 5). They are all detected in the survey of Pardo et al. (2022) towards IRC+10216. Table 6 groups these detections into four chemical families: cyanopolyynes, carbonchain radicals, Si-bearing molecules, and S-bearing molecules. The line intensities are comparable to those measured by Chau et al. (2012) at the same frequencies. Compared to Chau et al. (2012), our survey detects several additional transitions of cyanopolyyne species (HC3N, HC5N, HC7N) and new transitions of other molecules in CIT 6, including SiC2, C3S, C6H, C34 S, SiS, and 13CS. In total, we identify 29 new transition lines compared to the earlier study.
The cyanopolyyne family (HC2 n+1N) dominates the millimetre-wave spectra of both CIT 6 and IRC+10216 and serves as a benchmark for comparing their chemical and physical conditions. Rotational transitions of HC3N, HC5N, and HC7N are clearly detected in both sources within the 31−50 GHz band, in agreement with earlier Nobeyama 45 m surveys (Kawaguchi et al. 1995) and subsequent studies towards CIT 6 and IRC+10216 (Chau et al. 2012; Pardo et al. 2022). Seven detected transitions of HC5N and 17 of HC7N span a wide range of upper level energies, from 2−54 K for and 10−22 K, respectively. In IRC+10216, the lines are stronger than those in CIT 6 and display the characteristic double-peaked profiles expected from an expanding envelope with vexp ≃ 14.5 km s−1 (Pardo et al. 2022). Line shapes in CIT 6 are more asymmetric, with blueshifted wings dominating over the blue sides, which is consistent with previous reports that its envelope departs from spherical symmetry and exhibits incomplete shells (Chau et al. 2012).
The SiO spectrum towards CIT 6 shows enhanced emission in the redshifted wing, similar to IRC+10216, while 29SiO is only faintly detected. SiS is marginally detected (∼2σ in smoothed spectra) and is much stronger in IRC+10216. SiC2 emission is relatively strong with a broad profile. S-bearing species such as C3S, CS,13 CS, and C34 S are also strong, often with multiple spectral peaks. Two CCS lines and one SiS line appear weak (∼2σ). HC3N and H13 CCCN show strong emission, while other isotopologues are faint. HC5N lines are among the strongest features; unlike the horn-shaped profiles seen in IRC+10216, they display Gaussian-like profiles in CIT 6, with similar shapes across the two detected transitions. HC7N lines exhibit multiple peaks and hyperfine structures (see detailed figures in Appendix A).
Line parameters of detected species in CIT 6 observed with the eQ receiver at the NRO 45m telescope.
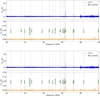 |
Fig. 1 Overview of the wide-band spectra from 30 to 50 GHz toward CIT 6 obtained with the eQ receiver on the NRO 45 m telescope. Different colours represent different spectral arrays of the SAM45 FX-type digital spectrometer. The dotted lines indicate some strong transition lines detected toward CIT 6. Zoom-in spectra are shown in Appendix A and B. |
Detected molecules in line survey towards CIT 6.
3.2 Integrated intensity
Line intensities in both CIT 6 and IRC+10216 were measured by numerical integration using the trapezoidal rule, over a frequency range of 5.86 MHz centred on the rest frequency. The resulting integrated intensities, Tint=∫ TSdv, are listed in Table 5. For lines detected in both our survey and that of Chau et al. (2012), the integrated intensities agree within 50%. In CIT 6, the peak and integrated intensities of most transitions are lower than of those measured in IRC+10216. This leads to 2.5–20 times lower column densities (see Sect. 4.1). Since its angular source diameter is larger than the beam, we do not need to correct for beam dilution towards IRC+10216.
3.3 Column density and excitation temperature determination
We derived molecular column densities using two complementary approaches, depending on the number and quality of detected transitions for each species.
3.3.1 Rotation-diagram analysis for HC5N and HC7N
For seven detected transitions of HC5N and 17 of HC7N that span a wide range of upper level energies (from 2−54 K for HC5N and 10−22 K for HC7N, respectively), we applied the rotational diagram method (Goldsmith & Langer 1999) to determine both the rotational temperature (Trot) and total column density (Ntot). Assuming optically thin emission and local thermodynamic equilibrium (LTE), the relationship between Trot and Ntot is given by
![Mathematical equation: $\ln \left(\frac{N_{\mathrm{u}}}{g_{\mathrm{u}}}\right)=\ln \left[\frac{3 k T_{\mathrm{int}}}{8 \pi^{3} v S \mu^{2}}\right]=\ln \left(\frac{N_{\mathrm{tot}}}{Q_{\mathrm{rot}}}\right)-\frac{E_{\mathrm{u}}}{k T_{\mathrm{rot}}},$](/articles/aa/full_html/2026/02/aa58033-25/aa58033-25-eq6.png) (3)
(3)
where Nu is the column density in the upper level, gu = 2 Ju + 1 is its degeneracy, k is the Boltzmann constant, v is the rest frequency, μ is the dipole moment, S is the line strength, μ2 S is given in Debye2 unit, Eu/k is the upper level energy in K, Q=kTrot/(hB) is the rotational partition function, and B is the rotational constant. Values of μ2 S and Eu/k are taken from Pardo et al. (2022) and the Splatalogue database1, while B is obtained from the JPL Molecular Spectroscopy Catalogue2.
Using integrated intensities derived in Sect. 3.2, the rotational diagrams of HC5N yield Trot = 24 ± 8 K and Ntot= 1.47 ± 0.34 × 1014 cm−2 for CIT 6, and Trot = 21 ± 6 K and Ntot= 8.67 ± 1.98 × 1014 cm−2 for IRC+10216 (Fig. 2). For HC7N, we obtain Trot = 30 ± 3 K and Ntot = 1.63 ± 0.21 × 1014 cm−2 for CIT 6, and Trot = 24 ± 2 K and Ntot = 8.88 ± 1.16 × 1014 cm−2 for IRC+10216. For IRC+10216, while column densities are consistent with the results obtained from the recent Yebes 40 m Q-band analysis (Pardo et al. 2022), our Trot of both HC5N and HC7N molecules are 11 K and 9 K higher, respectively. This might come from the fact that NRO 45 m has smaller beam, which probes relatively warmer inner regions of the envelope, possibly where dust condensation and UV photochemistry sustain ongoing carbon-chain formation. The original Nobeyama survey of IRC+10216 by Kawaguchi et al. (1995) derived Trot = 19 ± 2 K and Ntot = 1.1 × 1015 cm−2 for HC5N, values which are consistent with our IRC+10216 results to within 20%. The fact that Trot are higher in CIT 6 compared to IRC+10216 confirms that cyanopolyyne emission originates in a warmer region of its envelope; this is consistent with its more evolved status inferred from optical and infrared studies.
The column-density ratios between the two envelopes are N(HC5N)CIT6/N(HC5N)IRC+10216 ≈ 0.18 and N(HC7N)CIT6/N(HC7N)IRC+10216 ≈ 0.18. This is consistent with previous intensity ratios of ∼ 0.1−0.2 reported by Chau et al. (2012) and indicates that both species are depleted by a factor of 5-6 in CIT 6 relative to IRC+10216. Both sources show the expected decreasing trend N(HC3N)>N(HC5N)>N(HC7N), which is consistent with stepwise polymerisation reactions such as C2H+HC2n+1N → HC2 n+3 N+H (Pardo et al. 2022).
In conclusion, the derived rotation temperature and column density support the view that CIT 6 is slightly more evolved than IRC+10216.
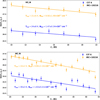 |
Fig. 2 Rotational diagrams of HC5N (a) and HC7N (b) constructed from transitions detected in our survey. The best-fit linear regressions are shown, from which the rotational temperatures (Trot) and total column densities (Ntot) are derived. Error bars represent the 15% uncertainties in the line intensities. |
Derivation of physical properties of detected molecules in CIT 6 derived from this survey.
3.3.2 LTE analysis of single transitions of other molecules
To derive the total column densities of all detected molecules under the assumption of LTE, we adopted a single excitation temperature of Tex = 25 K for both CIT 6 and IRC+10216. This representative temperature was chosen based on the cyanopolyyne analysis in Sect. 3.3.1, where the rotational diagrams of HC5N and HC7N yielded Trot values in the 20−30 K range for both sources. Although a uniform temperature approximation introduces uncertainties for species with significantly different excitation conditions, it allows a consistent, comparative assessment of molecular abundances across the Q-band data set.
Column densities were calculated using the standard optically thin LTE expression
 (4)
(4)
where v is the rest frequency (Hz), S μ2 the line strength (D2), gu the upper level degeneracy, Eu the upper level energy (K), and Qrot(Tex)=kTex/(hB) the rotational partition function for a linear rotor. The integrated intensity, Tint (K km s−1), is derived in Sect. 3.2. The estimated uncertainty of each column density is ∼ 30%, combining the calibration error, baseline subtraction, and the uncertainty associated with the adopted single Tex.
Figure 3 compares the LTE column densities obtained for all molecules in CIT 6 and IRC+10216. Most molecular column densities in CIT 6 are generally lower than in IRC+10216 by factors of 2−10. A few species, such as SiO, are similar in both sources suggesting enhanced emission or less depletion in the warmer, inner envelope of CIT 6.
The derived column densities span 4 × 10¹²−1.4 × 1015 cm−2 for both sources, which is consistent with previous Q-band surveys (Kawaguchi et al. 1995; Chau et al. 2012; Pardo et al. 2022). The global offset between the two envelopes mirrors that found for the cyanopolyynes (Sect. 3.3.1), reinforcing the view that CIT 6 is chemically similar to IRC+10216, but less abundant in most molecular species due to its more evolved and possibly more diluted circumstellar envelope.
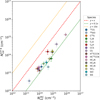 |
Fig. 3 Comparison of molecular column densities in CIT 6 and IRC+10216 derived from our survey data. The dashed red line marks the one-to-one relation, where both sources have equal column densities. The dashed yellow line indicates where column densities in CIT 6 are two times lower than in IRC+10216, while the dashed green line shows the case where column densities in CIT 6 are ten times lower. Most species are less abundant in CIT 6 by factors of 2-10, while a few (e.g. SiO) show comparable column densities. A detailed breakdown of relative abundances with respect to HC3N, C34S, and SiO is provided in Table 7 and 8. |
4 Discussion
4.1 Molecular inventory and comparison with IRC+10216
Our Q-band survey towards CIT 6 reveals a molecular inventory dominated by carbon chains, cyanopolyynes, and S/Si-bearing species such as HC3N, HC5N, HC7N, C3S, C6H, SiC2, SiS, and SiO. All of these molecules are also detected towards IRC+10216 (see Sect. 3). Fig. 3 compares the column-density values of CIT6 and IRC+10216 for each species. The derived column densities span 4 × 10¹²−1.4 × 1015 cm−2 for both sources, with a clear systematic offset between the two envelopes. Across the full sample, the ratios NCIT6/NIRC+10216 range from ∼ 0.05 to ∼ 0.4, with a median of 0.15, indicating that the molecular column densities in CIT 6 are typically five-to-ten-times lower than in IRC+10216. The most suppressed species in CIT 6 are SiS (0.05) and C3N (0.09), while relatively carbon-rich radicals such as C6H approach parity with ratios of ∼ 0.4. Among the Si-bearing molecules, SiO is only modestly depleted (NCIT6/NIRC = 0.21); this is consistent with its emission originating from a warmer and more compact region of the envelope.
The overall trend confirms that carbon-chain molecules (e.g. HCnN and CnH) remain prominent in CIT 6, whereas Si- and S-bearing species are systematically weaker than in IRC+10216. This pattern suggests that (i) the outer envelope of CIT 6 still sustains efficient carbon-chain growth, but (ii) Si- and S-bearing molecules are more heavily depleted, likely through enhanced dust condensation or shock-driven chemistry. The same behaviour is evident when abundances are normalised to reference species such as SiO, HC3N, or C34 S (Table 8).
Using SiO as a reference, SiS is under-abundant in CIT 6 by a factor of ∼ 2.17 compared with IRC+10216 ([SiS/SiO]CIT = 0.56 vs. [SiS/SiO]IRC = 1.22). This depletion implies that a larger fraction of Si is locked in dust grains or that SiS destruction by shocks is more effective in CIT 6. Similar depletion of CS and C3S further indicates a general suppression of gas-phase S-bearing species, possibly due to different dust-formation efficiency or freeze-out conditions.
Relative abundances of detected molecules in CIT 6 and IRC+10216 with HC3N, C34 S, SiC2, and SiO as references.
Isotopic ratios derived from LTE column densities of CIT 6 and IRC+10216 (this work), with benchmarks.
4.2 Isotopic ratios
Isotopic ratios provide powerful diagnostics of stellar nucleosyn-thesis and Galactic chemical evolution, as they trace the products of nuclear processing and convective dredge-up in evolved stars (Kahane et al. 1988; Wilson & Rood 1994; Herwig 2005; Peng et al. 2013). During the thermally pulsing AGB phase, repeated dredge-up events transport the ashes of He-shell burning (mainly C, N, F, and s-process elements) to the surface, modifying the isotopic composition of the CSE (Busso et al. 1999; Herwig 2005; Cristallo et al. 2009; Zhang et al. 2013; Wasserburg et al. 2017). The resulting isotopic yields strongly depend on the stellar mass and metallicity (Peng et al. 2013), leaving observable signatures in the surrounding ISM. Although IRC+10216 resides in the solar neighbourhood, its isotopic composition is known to be markedly non-solar (Kahane et al. 1988, 1992; Cernicharo et al. 2000), reflecting significant enrichment by processed material following late dredge-up episodes.
We derived isotopic ratios using the column densities derived in Sect. 3.3. When the main isotopologue is optically thick, the resulting ratios represent apparent lower limits. To mitigate optical-depth effects, we preferentially used optically thinner isotopic pairs, and, where necessary, we used optical-depth corrections (Linke et al. 1977; Kahane et al. 1988; Cernicharo et al. 2000). The resulting ratios for both CIT 6 and IRC+10216 are summarised in Table 9 and illustrated in Fig. 4.
From the CS isotopologues, we formed
![Mathematical equation: $\left[\frac{{}^{12} \mathrm{C}}{{}^{13} \mathrm{C}}\right]_{\mathrm{app}} \simeq \frac{N(\mathrm{CS})}{N\left({}^{13} \mathrm{CS}\right)}, \quad\left[\frac{{}^{32} \mathrm{~S}}{{}^{34} \mathrm{~S}}\right]_{\mathrm{app}} \simeq \frac{N(\mathrm{CS})}{N\left(\mathrm{C}^{34} \mathrm{~S}\right)}.$](/articles/aa/full_html/2026/02/aa58033-25/aa58033-25-eq8.png) (5)
(5)
A more robust, opacity-independent ratio can be obtained from the thin pair:
 (6)
(6)
which constrains the product of the two elemental ratio.
Using the column densities in Table 7, for CIT 6 we obtain N(CS)/N(13 CS) = 18.1 ± 7.7, N(CS)/N(C34 S) = 23.4 ± 9.9, and N(C34 S)/N(13 CS) = 0.52 ± 0.16. For IRC+10216, the corresponding ratios are 13.0 ± 5.5, 25.3 ± 10.8, and 0.36 ± 0.11, respectively. Adopting the solar 32S/34 S ratio of 22.1 (Asplund et al. 2009), Eq. (6) implies 12C/13C ≃ 11.5 ± 3.6 in CIT 6 and ≃ 8.0 ± 2.5 in IRC+10216. These values are significantly below the solar value (89.4) and the local ISM average (54 ± 10), confirming the well-known non-solar 12C/13 C ratio in IRC+10216 and revealing a similarly low value in CIT 6.
From the SiO family, we derive
![Mathematical equation: $\left[\frac{{}^{28} \mathrm{Si}}{{}^{29} \mathrm{Si}}\right]_{\text {app}}=\frac{N(\mathrm{SiO})}{N\left({}^{29} \mathrm{SiO}\right)} = 10.9 \pm 4.6(\mathrm{CIT}), 18.5 \pm 7.9(\mathrm{IRC}),$](/articles/aa/full_html/2026/02/aa58033-25/aa58033-25-eq10.png)
again representing apparent lower limits if the SiO is optically thick. Previous studies have reported somewhat higher values from SiS transitions (28 Si/29 Si ≈ 17 ± 5.; Cernicharo et al. 2000; Fonfría et al. 2015), consistently with our measurements given the different excitation and opacity of SiO lines.
For HC3N, we find apparent ratios of N(HC3N)/N(H13 CCCN) = 29.8 ± 8.3 for CIT 6, and 18.0 ± 5.0 for IRC+10216. We also find N(HC3N)/N(HC13 CCN)= 19.6 ± 5.5 for CIT 6, and 19.8 ± 5.5 for IRC+10216. When compared with the isotopic ratios derived from the CS system (Sect. 4.2 and Table 9), the HC3N-based apparent 12C/13C ratios are systematically higher than the opacity-corrected thin-pair values. This difference likely reflects the lower optical depth of HC3N compared with CS. After accounting for line opacity and excitation differences, both tracers converge towards a consistent elemental 12C/13 C of ∼ 11.5 in CIT 6 and ∼ 8.0 in IRC+10216, in agreement with previous high-sensitivity studies (e.g. Kahane et al. 1988; Cernicharo et al. 2000; Pardo et al. 2022).
Overall, the isotopic composition of CIT 6 mirrors that of IRC+10216 within uncertainties, showing comparably low 12C/13 C(∼ 10−20) and slightly sub-solar 28Si/29 Si(∼ 10−20). Both stars thus display the characteristic isotopic signatures of advanced AGB evolution (Massalkhi et al. 2018, 2019). The low 12C/13 C ratios confirm substantial enrichment in CN-cycle material and are consistent with isotopic mixing models for low-to-intermediate-mass carbon stars. CIT 6 therefore appears chemically similar to IRC+10216 but slightly more evolved, with deeper dredge-up and enhanced dust condensation leaving a strong isotopic imprint on its present-day CSE.
 |
Fig. 4 Apparent isotopic ratios derived from column densities in CIT 6 (blue) and IRC+10216 (orange). |
4.3 13C isotopic fractionation in HC3N
The isotopic distribution within HC3N provides additional insight into carbon fractionation and formation pathways. In CIT 6, the isotopomers H13 CCCN and HC13 CCN have column densities of N = 1.37 × 10¹³ and 2.08 × 1013 cm−2, respectively, compared with N(HC3N) = 4.08 × 1014 cm−2. These correspond to 3.4% and 5.1% of the main isotopologue abundance. The resulting isotopomer ratios are N(HC13 CCN)/N(H13 CCCN)= 1.52 ± 0.43, \quad N(HC3N)/N(H13 CCCN) = 29.8 ± 8.3, and N(HC3N)/N(HC13 CCN) = 19.6 ± 5.5. In IRC+10216, the corresponding column densities are N(H13 CCCN) = 9.81 × 10¹³, N(HC13 CCN) = 8.95 × 10¹³, and N(HC3N) = 1.77 × 1015 cm−2. The isotopomer ratios are N(HC13 CCN)/N(H13 CCCN)= 0.91 ± 0.26, \quad N(HC3N)/N(H13 CCCN) = 18.0 ± 5.0, and N(HC3N)/N(HC13 CCN) = 19.8 ± 5.5 (see Table 10).
These results show that in CIT 6 the central-carbon iso-topomer (HC13CCN) is somewhat more abundant than the terminal-carbon isotopomer (H13 CCCN), whereas in IRC+10216 the two are nearly equal. Both sources exhibit isotopomer ratios with respect to the main isotopologue of 20-30, implying modest 13C enrichment relative to the main isotopologue. The similar isotopomer pattern between the two envelopes indicates that fractionation processes in CIT 6 remain comparable to those operating in IRC+10216 and in cold dark clouds such as TMC-1 (Takano et al. 1998; Taniguchi et al. 2017). HCC13 CN, which is often the most abundant isotopomer in TMC-1, is not detected in our CIT 6 data, but it has been identified towards IRC+10216 in deeper Yebes observations (Pardo et al. 2022).
As emphasised by Massalkhi et al. (2019), isotopomer patterns must be interpreted with care, since line opacity and selective photodissociation can bias direct ratios. Nevertheless, the close match between CIT 6 and IRC+10216 suggests similar HC3N formation pathways – likely dominated by reactions of CN with C2H2− and comparable isotopic exchange efficiencies. The modest central-carbon enhancement in CIT 6 could hint at slightly different excitation or fractionation conditions, possibly linked to its more evolved circumstellar envelope and stronger dust condensation activity.
Isotopomer ratios in CIT 6 and IRC+10216.
5 Conclusions
We conducted a complete 30−50 GHz spectral-line survey of the carbon star CIT 6 with the new eQ receiver on the NRO 45 m telescope, accompanied by comparative observations of IRC+10216. The high sensitivity of the eQ system (∼ 5−10 mK per 240 kHz channel) enabled the first full Q-band molecular inventory of CIT 6. Our principal findings are as follows:
We detected 42 emission lines from 16 molecular species in CIT 6, including cyanopolyynes (HC3N, HC5N, HC7N), carbon-chain radicals (C6H, C3N, CCS, C3S), and Si/S-bearing molecules (SiO, SiS, SiC2, CS, C34 S,13 CS). Among them, 29 transitions are newly identified in the Q band towards CIT 6;
The molecular column densities of CIT 6 are systematically lower than those of IRC+10216 by factors of ∼ 2.5−20 (median ratio ≃ 0.15). Si- and S-bearing species (e.g. SiS, CS, C3S) are the most depleted, while carbon-chain species such as C6H and HCnN remain relatively strong, indicating efficient carbon-chain formation despite the star’s advanced evolutionary state;
Rotational-diagram analysis of HC5N and HC7N yields Trot = 24 ± 8 K and Ntot = 1.47 ± 0.34 × 1014 cm−2 for CIT 6, and Trot = 21 ± 6 K and Ntot = 8.67 ± 1.98 × 1014 cm−2 for IRC+10216. The higher Trot in CIT 6 suggests emission from warmer regions closer to the star, possibly linked to enhanced infrared pumping or shock heating within its asymmetric envelope;
Using a single excitation temperature of Tex = 25 K for all other species, we derived LTE column densities spanning 1012−1015 cm−2. Normalised abundance ratios show that C6H and CCS are enhanced in CIT 6 relative to both HC3N and C34 S, while SiS and C3N are depleted. These trends indicate that CIT 6 exhibits comparatively stronger carbon-chain and early-time sulfur chemistry, but more efficient depletion of refractory elements into dust grains;
Isotopic analysis confirms significant non-solar enrichment patterns. From the CS family, we obtain apparent ratios of 12C/13 C = 18.1 ± 7.7 and 32S/34 S = 23.4 ± 9.9 for CIT 6, and 13.0 ± 5.5 and 25.3 ± 10.8 for IRC+10216, respectively. Using the opacity-independent thin pair C34 S/13 CS and adopting 32S/34 S = 22.1, we infer 12C/13C = 11.5 ± 3.6 for CIT 6 and 8.0 ± 2.5 for IRC+10216. From SiO, we find 28Si/29Si = 10.9 ± 4.6 for CIT 6 and 18.5 ± 7.9 for IRC +10216. All values are far below the solar 12C/13C = 89.4, consistent with strong internal processing and dredge-up in both envelopes;
HC3N isotopomer analysis further reveals apparent 12C/13C ratios of ∼ 20−30, which are systematically higher than those derived from CS due to lower opacity, and consistent with a true elemental ratio of 20-30 (CIT 6) and 15-25 (IRC+10216) after opacity correction;
Overall, both envelopes display canonical carbon-rich AGB chemistry and comparable isotopic compositions. CIT 6, however, shows slightly higher excitation temperatures, stronger carbon-chain growth, and deeper depletion of Si- and S-bearing species. These signatures point to a more evolved circumstellar environment, where dust condensation and shock processing have further modulated the molecular composition.
Data availability
The reduced spectra are available at the CDS via https://cdsarc.cds.unistra.fr/viz-bin/cat/J/A+A/706/A127. Figures B.1 to B.11 in Appendix B are available via Zenodo.
Acknowledgements
Part of this work was supported by the NAOJ Visiting Research Grant. This work was financially supported by JSPS KAKENHI Grant Numbers JP23H01218 (F.N.). We were partly supported by a grant from the Simons Foundation (916424, N.H.), in addition to the enthusiastic support of the IFIRSE/ICISE staff. One of the authors (Dinh-V-Trung) highly acknowledges the Vietnam Academy of Science and Technology for support for senior researchers (Grant No. NVCC05.02/22-23). We thank the referee for constructive comments that improved the quality of the manuscript. Software: Astropy (Astropy Collaboration 2013, 2018, 2022), Matplotlib (Hunter 2007), NumPy (Harris et al. 2020), SciPy (Virtanen et al. 2020).
References
- Agúndez, M., Cernicharo, J., Quintana-Lacaci, G., et al. 2017, A&A, 601, A4 [Google Scholar]
- Alksnis, A. K., & Khozov, G. V., 1975, Sov. Astron. Lett., 1, 144 [Google Scholar]
- Asplund, M., Grevesse, N., Sauval, A. J., & Scott, P., 2009, ARA&A, 47, 481 [CrossRef] [Google Scholar]
- Astropy Collaboration (Robitaille, T. P., et al.,) 2013, A&A, 558, A33 [NASA ADS] [CrossRef] [EDP Sciences] [Google Scholar]
- Astropy Collaboration (Price-Whelan, A. M., et al.,) 2018, AJ, 156, 123 [Google Scholar]
- Astropy Collaboration (Price-Whelan, A. M., et al.,) 2022, ApJ, 935, 167 [NASA ADS] [CrossRef] [Google Scholar]
- Busso, M., Gallino, R., & Wasserburg, G. J., 1999, ARA&A, 37, 239 [Google Scholar]
- Cernicharo, J., Guélin, M., & Kahane, C., 2000, A&AS, 142, 181 [NASA ADS] [Google Scholar]
- Chau, W., Zhang, Y., Nakashima, J.-I., Deguchi, S., & Kwok, S., 2012, ApJ, 760, 66 [Google Scholar]
- Chiong, C.-C., Nakamura, F., Nishimura, A., et al. 2022, SPIE Conf. Ser., 12190, 121900M [Google Scholar]
- Cohen, M., & Hitchon, K., 1996, AJ, 111, 962 [Google Scholar]
- Cristallo, S., Straniero, O., Gallino, R., et al. 2009, ApJ, 696, 797 [NASA ADS] [CrossRef] [Google Scholar]
- De Beck, E., Lombaert, R., Agúndez, M., et al. 2012, A&A, 539, A108 [NASA ADS] [CrossRef] [EDP Sciences] [Google Scholar]
- Dinh-V-Trung, & Lim, J. 2008, ApJ, 678, 303 [Google Scholar]
- Dinh-V.-Trung, & Lim, J. 2009, ApJ, 701, 292 [Google Scholar]
- Dinh-V-Trung, Bao, N. T. T., Tien, P. M., et al. 2022, AJ, 164, 219 [Google Scholar]
- Fonfría, J. P., Cernicharo, J., Richter, M. J., et al. 2015, MNRAS, 453, 439 [CrossRef] [Google Scholar]
- Fukasaku, S., Hirahara, Y., Masuda, A., et al. 1994, ApJ, 437, 410 [Google Scholar]
- Goldsmith, P. F., & Langer, W. D., 1999, ApJ, 517, 209 [Google Scholar]
- Groenewegen, M. A. T., van der Veen, W. E. C. J., & Matthews, H. E., 1998, A&A, 338, 491 [NASA ADS] [Google Scholar]
- Groenewegen, M. A. T., Barlow, M. J., Blommaert, J. A. D. L., et al. 2012, A&A, 543, L8 [NASA ADS] [CrossRef] [EDP Sciences] [Google Scholar]
- Harris, C. R., Millman, K. J., van der Walt, S. J., et al. 2020, Nature, 585, 357 [NASA ADS] [CrossRef] [Google Scholar]
- He, J. H., Dinh-V-Trung, Kwok, S., et al. 2008, ApJS, 177, 275 [NASA ADS] [CrossRef] [Google Scholar]
- He, J. H., Dinh-V-Trung, & Hasegawa, T. I. 2017, ApJ, 845, 38 [NASA ADS] [CrossRef] [Google Scholar]
- Henkel, C., Matthews, H. E., Morris, M., Terebey, S., & Fich, M., 1985, A&A, 147, 143 [Google Scholar]
- Herwig, F., 2005, ARA&A, 43, 435 [Google Scholar]
- Hirano, N., Shinnaga, H., Dinh-V-Trung, et al. 2004, ApJ, 616, L43 [NASA ADS] [CrossRef] [Google Scholar]
- Hirano, N., Chiu, P.-J., Muller, S., & Trung, D.-V., 2005, J. Korean Astron. Soc., 38, 219 [Google Scholar]
- Hunter, J. D., 2007, Comput. Sci. Eng., 9, 90 [NASA ADS] [CrossRef] [Google Scholar]
- Jura, M., 1986, ApJ, 303, 327 [Google Scholar]
- Kahane, C., Gomez-Gonzalez, J., Cernicharo, J., & Guelin, M., 1988, A&A, 190, 167 [NASA ADS] [Google Scholar]
- Kahane, C., Cernicharo, J., Gomez-Gonzalez, J., & Guelin, M., 1992, A&A, 256, 235 [NASA ADS] [Google Scholar]
- Kawaguchi, K., Kasai, Y., Ishikawa, S.-I., & Kaifu, N., 1995, PASJ, 47, 853 [Google Scholar]
- Kim, H., Hsieh, I. T., Liu, S.-Y., & Taam, R. E., 2013, ApJ, 776, 86 [Google Scholar]
- Kim, H., Liu, S.-Y., Hirano, N., et al. 2015, ApJ, 814, 61 [Google Scholar]
- Ladjal, D., Barlow, M. J., Groenewegen, M. A. T., et al. 2010, A&A, 518, L141 [NASA ADS] [CrossRef] [EDP Sciences] [Google Scholar]
- Linke, R. A., Goldsmith, P. F., Wannier, P. G., Wilson, R. W., & Penzias, A. A., 1977, ApJ, 214, 50 [NASA ADS] [CrossRef] [Google Scholar]
- Massalkhi, S., Agúndez, M., Cernicharo, J., et al. 2018, A&A, 611, A29 [CrossRef] [EDP Sciences] [PubMed] [Google Scholar]
- Massalkhi, S., Agúndez, M., & Cernicharo, J., 2019, A&A, 628, A62 [CrossRef] [EDP Sciences] [PubMed] [Google Scholar]
- Menten, K. M., Reid, M. J., Kamiński, T., & Claussen, M. J., 2012, A&A, 543, A73 [NASA ADS] [CrossRef] [EDP Sciences] [Google Scholar]
- Nakamura, F., Chiong, C.-C., Taniguchi, K., et al. 2024, PASJ, 76, 563 [NASA ADS] [CrossRef] [Google Scholar]
- Pardo, J. R., Cernicharo, J., Tercero, B., et al. 2022, A&A, 658, A39 [NASA ADS] [CrossRef] [EDP Sciences] [Google Scholar]
- Patel, N. A., Young, K. H., Brünken, S., et al. 2009, ApJ, 692, 1205 [NASA ADS] [CrossRef] [Google Scholar]
- Peng, T. C., Humphreys, E. M. L., Testi, L., et al. 2013, A&A, 559, L8 [NASA ADS] [CrossRef] [EDP Sciences] [Google Scholar]
- Ramstedt, S., & Olofsson, H., 2014, A&A, 566, A145 [NASA ADS] [CrossRef] [EDP Sciences] [Google Scholar]
- Remijan, A. J., Markwick-Kemper, A., & ALMA Working Group on Spectral Line Frequencies. 2007, in American Astronomical Society Meeting Abstracts, 211, American Astronomical Society Meeting Abstracts, 132.11 [Google Scholar]
- Schmidt, G. D., Hines, D. C., & Swift, S., 2002, ApJ, 576, 429 [NASA ADS] [Google Scholar]
- Takano, S., Masuda, A., Hirahara, Y., et al. 1998, A&A, 329, 1156 [NASA ADS] [Google Scholar]
- Taniguchi, K., Ozeki, H., & Saito, M., 2017, ApJ, 846, 46 [NASA ADS] [CrossRef] [Google Scholar]
- Taniguchi, K., Gorai, P., & Tan, J. C. 2024a, Ap&SS, 369, 34 [NASA ADS] [CrossRef] [Google Scholar]
- Taniguchi, K., Nakamura, F., Liu, S.-Y., et al. 2024b, PASJ, 76, 1270 [Google Scholar]
- Tercero, F., López-Pérez, J. A., Gallego, J. D., et al. 2021, A&A, 645, A37 [EDP Sciences] [Google Scholar]
- Tuo, J., Li, X., Sun, J., et al. 2024, ApJS, 271, 45 [Google Scholar]
- Ulrich, B. T., Neugebauer, G., McCammon, D., et al. 1966, ApJ, 146, 288 [Google Scholar]
- Virtanen, P., Gommers, R., Oliphant, T. E., et al. 2020, Nat. Methods, 17, 261 [Google Scholar]
- Wallerstein, G., & Knapp, G. R., 1998, ARA&A, 36, 369 [Google Scholar]
- Wasserburg, G. J., Karakas, A. I., & Lugaro, M., 2017, ApJ, 836, 126 [Google Scholar]
- Whitelock, P. A., Feast, M. W., Marang, F., & Groenewegen, M. A. T., 2006, MNRAS, 369, 751 [NASA ADS] [CrossRef] [Google Scholar]
- Wilson, T. L., & Rood, R., 1994, ARA&A, 32, 191 [Google Scholar]
- Yan, Y. T., Henkel, C., Kobayashi, C., et al. 2023, A&A, 670, A98 [NASA ADS] [CrossRef] [EDP Sciences] [Google Scholar]
- Yang, K., Zhang, Y., Qiu, J., Ao, Y., & Li, X., 2023, PASJ, 75, 853 [Google Scholar]
- Zhang, B., Zheng, X. W., Reid, M. J., et al. 2009a, ApJ, 693, 419 [Google Scholar]
- Zhang, Y., Kwok, S., & Dinh-V-Trung. 2009b, ApJ, 691, 1660 [Google Scholar]
- Zhang, B., Reid, M. J., Menten, K. M., et al. 2013, ApJ, 775, 79 [Google Scholar]
Appendix A Zoom-in views of several molecular line profiles
Figs. A.1, A.2, A.3, A.4, and A.5 show the line profiles of siliconbearing molecules, sulfur-bearing molecules, carbon-chain radicals, HC3N, and HC5N, respectively.
Some spectral line profiles towards IRC+10216 display a symmetric double-peaked structure, characteristic of optically thin emission from an expanding, spherically symmetric circumstellar envelope (Dinh-V-Trung & Lim 2008). The blue- and red-shifted peaks arise from the front and back hemispheres of the outflow, respectively, and their velocity separation corresponds to approximately twice the terminal expansion velocity of the envelope (∼ 14 km s−1 for IRC+10216). The central dip is due to the reduced line-of-sight velocity gradient near the systemic velocity.
In contrast to IRC+10216, the spectral line profiles towards CIT 6 often exhibit an asymmetric double-peaked or skewed structure, which has been attributed to the presence of a spiral density pattern in the circumstellar envelope, likely induced by binary interaction. In such a configuration, the velocity-integrated emission from the spiral arms is not evenly distributed between the approaching and receding sides, resulting in unequal peak intensities. The asymmetry is further enhanced by local density and temperature variations along the spiral, as revealed by high-resolution interferometric imaging (Kim et al. 2015).
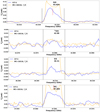 |
Fig. A.1 Spectra of silicon-bearing molecules towards CIT 6 smoothed by a factor of 5 (blue) and IRC+10216 (orange). The intensity of the IRC+10216 spectra is divided by 5. |
Appendix B Spectra of individual 1 GHz frequency chunks towards CIT 6 and IRC+10216
Appendix B is available via Zenodo (https://zenodo.org/records/17924939), where we present the spectra of each individual 1 GHz band in the 30−50 GHz range towards CIT 6 and IRC+10216. The identified transition lines and molecular names are highlighted in green. The full list of detected transitions can be found in Tab. 5. See Tabs. 3 and 4 for details of the observations, including rms noise levels, observing periods, and integration times.
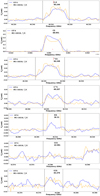 |
Fig. A.2 Spectra of sulfur-bearing molecules towards CIT 6 smoothed by a factor of 5 (blue) and IRC+10216 (orange). The intensity of the IRC+10216 spectra is divided by 5. |
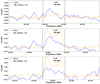 |
Fig. A.3 Spectra of carbon-chain radical molecules towards CIT 6 smoothed by a factor of 5 (blue) and IRC+10216 (orange). The intensity of the IRC+10216 spectra is divided by 5. |
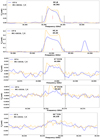 |
Fig. A.4 Spectra of HC3N and its isotopologues towards CIT 6 smoothed by a factor of 5 (blue) and IRC+10216 (orange). The intensity of the IRC+10216 spectra is divided by 5. |
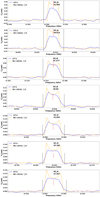 |
Fig. A.5 Spectra of HC5N towards CIT 6 smoothed by a factor of 5 (blue) and IRC+10216 (orange). The intensity of the IRC+10216 spectra is divided by 5. |
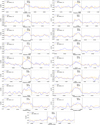 |
Fig. A.6 Spectra of HC7N towards CIT 6 smoothed by a factor of 5 (blue) and IRC+10216 (orange). The intensity of the IRC+10216 spectra is divided by 5. |
All Tables
Line parameters of detected species in CIT 6 observed with the eQ receiver at the NRO 45m telescope.
Derivation of physical properties of detected molecules in CIT 6 derived from this survey.
Relative abundances of detected molecules in CIT 6 and IRC+10216 with HC3N, C34 S, SiC2, and SiO as references.
Isotopic ratios derived from LTE column densities of CIT 6 and IRC+10216 (this work), with benchmarks.
All Figures
|
Fig. 1 Overview of the wide-band spectra from 30 to 50 GHz toward CIT 6 obtained with the eQ receiver on the NRO 45 m telescope. Different colours represent different spectral arrays of the SAM45 FX-type digital spectrometer. The dotted lines indicate some strong transition lines detected toward CIT 6. Zoom-in spectra are shown in Appendix A and B. |
| In the text | |
|
Fig. 2 Rotational diagrams of HC5N (a) and HC7N (b) constructed from transitions detected in our survey. The best-fit linear regressions are shown, from which the rotational temperatures (Trot) and total column densities (Ntot) are derived. Error bars represent the 15% uncertainties in the line intensities. |
| In the text | |
|
Fig. 3 Comparison of molecular column densities in CIT 6 and IRC+10216 derived from our survey data. The dashed red line marks the one-to-one relation, where both sources have equal column densities. The dashed yellow line indicates where column densities in CIT 6 are two times lower than in IRC+10216, while the dashed green line shows the case where column densities in CIT 6 are ten times lower. Most species are less abundant in CIT 6 by factors of 2-10, while a few (e.g. SiO) show comparable column densities. A detailed breakdown of relative abundances with respect to HC3N, C34S, and SiO is provided in Table 7 and 8. |
| In the text | |
|
Fig. 4 Apparent isotopic ratios derived from column densities in CIT 6 (blue) and IRC+10216 (orange). |
| In the text | |
|
Fig. A.1 Spectra of silicon-bearing molecules towards CIT 6 smoothed by a factor of 5 (blue) and IRC+10216 (orange). The intensity of the IRC+10216 spectra is divided by 5. |
| In the text | |
|
Fig. A.2 Spectra of sulfur-bearing molecules towards CIT 6 smoothed by a factor of 5 (blue) and IRC+10216 (orange). The intensity of the IRC+10216 spectra is divided by 5. |
| In the text | |
|
Fig. A.3 Spectra of carbon-chain radical molecules towards CIT 6 smoothed by a factor of 5 (blue) and IRC+10216 (orange). The intensity of the IRC+10216 spectra is divided by 5. |
| In the text | |
|
Fig. A.4 Spectra of HC3N and its isotopologues towards CIT 6 smoothed by a factor of 5 (blue) and IRC+10216 (orange). The intensity of the IRC+10216 spectra is divided by 5. |
| In the text | |
|
Fig. A.5 Spectra of HC5N towards CIT 6 smoothed by a factor of 5 (blue) and IRC+10216 (orange). The intensity of the IRC+10216 spectra is divided by 5. |
| In the text | |
|
Fig. A.6 Spectra of HC7N towards CIT 6 smoothed by a factor of 5 (blue) and IRC+10216 (orange). The intensity of the IRC+10216 spectra is divided by 5. |
| In the text | |
Current usage metrics show cumulative count of Article Views (full-text article views including HTML views, PDF and ePub downloads, according to the available data) and Abstracts Views on Vision4Press platform.
Data correspond to usage on the plateform after 2015. The current usage metrics is available 48-96 hours after online publication and is updated daily on week days.
Initial download of the metrics may take a while.