Fig. 3.
Download original image
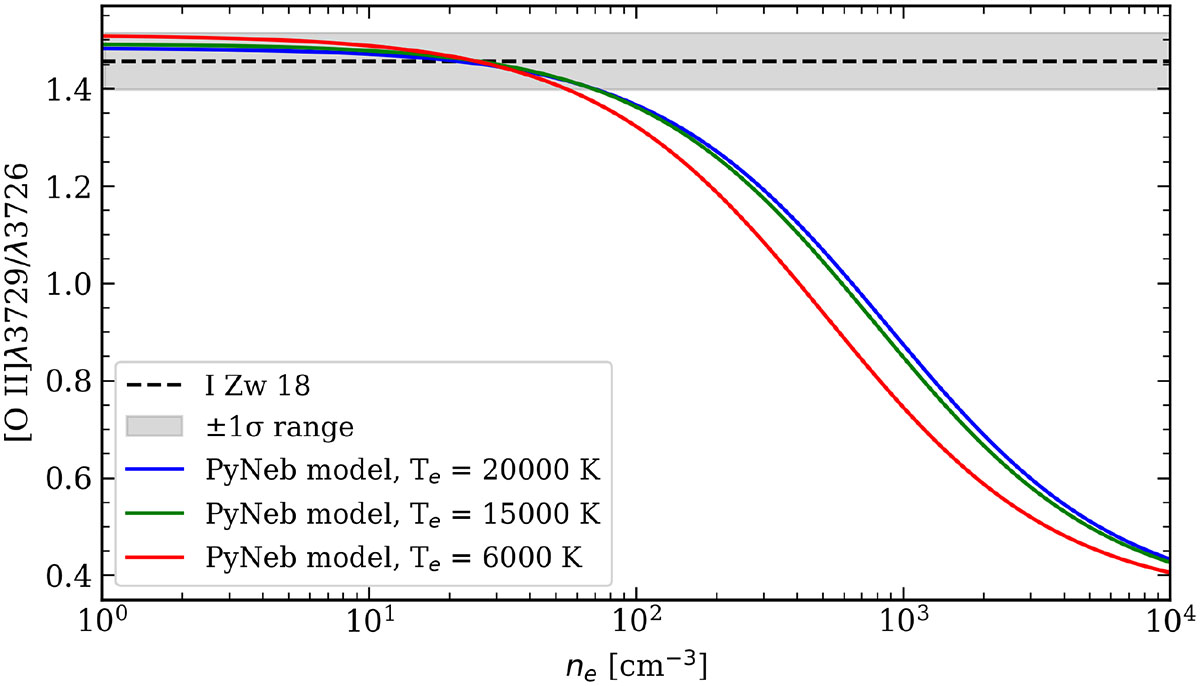
[O II]λ3729/[O II]λ3726 ratio as a function of ne. The solid blue line represents the PyNeb model for Te = 20 000 K, which is typical for extremely low-metallicity H II regions. For comparison, the solid red line represents the PyNeb model for Te = 6000 K. The dotted line and gray area show the [O II]λ3729/[O II]λ3726 ratio derived from DESI spectrum and its uncertainty.
Current usage metrics show cumulative count of Article Views (full-text article views including HTML views, PDF and ePub downloads, according to the available data) and Abstracts Views on Vision4Press platform.
Data correspond to usage on the plateform after 2015. The current usage metrics is available 48-96 hours after online publication and is updated daily on week days.
Initial download of the metrics may take a while.