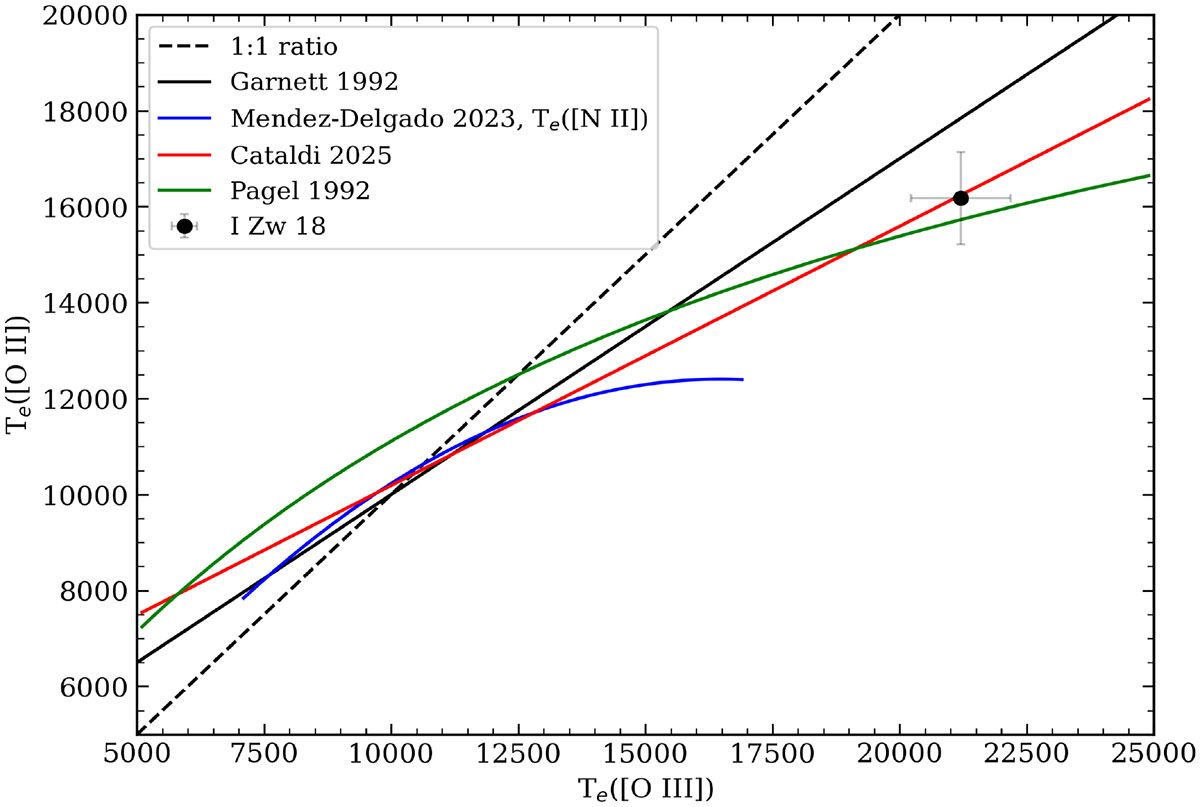
Fig. 4.
Download original image
Te([O II]) as a function of Te([O III]) for the model from Garnett (1992) (solid black line) in comparison with Te([O II]) and Te([O III]) derived for the SE knot in I Zw 18 (black circle). The solid blue line represents the quadratic model from Méndez-Delgado et al. (2023) for Te([N II]) as a function of Te([O III]), and the red and green lines represent the relations from Cataldi et al. (2025) and Pagel et al. (1992), respectively. For this model, we preserved a limited range of Te([O III]), which represents the range of Te([O III]) in its calibration sample.
Current usage metrics show cumulative count of Article Views (full-text article views including HTML views, PDF and ePub downloads, according to the available data) and Abstracts Views on Vision4Press platform.
Data correspond to usage on the plateform after 2015. The current usage metrics is available 48-96 hours after online publication and is updated daily on week days.
Initial download of the metrics may take a while.