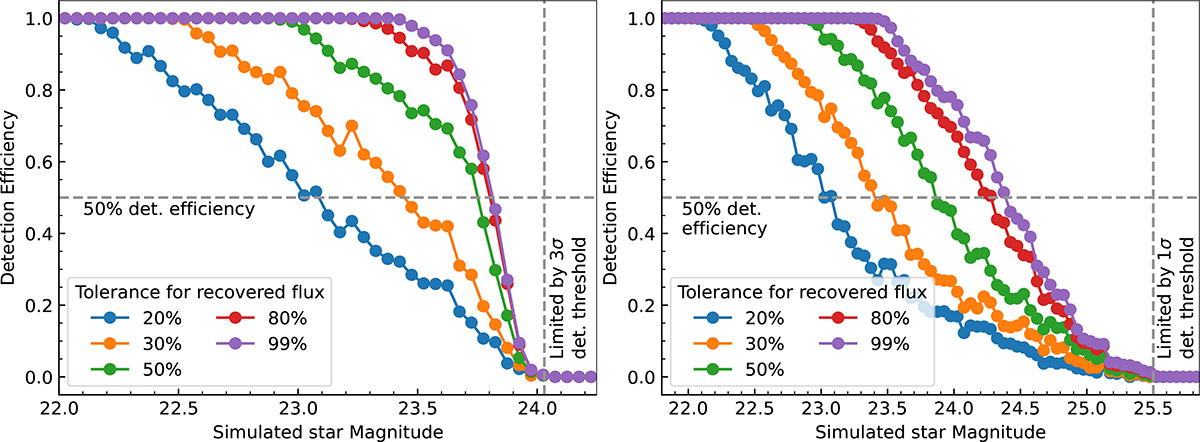
Fig. 11.
Download original image
Left: Detection efficiency as a function of magnitude with a 3σ detection threshold. Each curve is based on 30 000 simulated images, generated by adding an artificial star drawn from a uniform distribution over the magnitude range and within a 4 ⋅ FWHM square region around the SN position. The different curves correspond to varying tolerances between the recovered flux and the true flux of the input star. A detection is counted as successful if the recovered flux lies within the specified tolerance level of the input artificial star. Right: Same as left panel, but using 1σ detection threshold and 50 000 simulations within a magnitude range of 21.75 to 25.75 mag.
Current usage metrics show cumulative count of Article Views (full-text article views including HTML views, PDF and ePub downloads, according to the available data) and Abstracts Views on Vision4Press platform.
Data correspond to usage on the plateform after 2015. The current usage metrics is available 48-96 hours after online publication and is updated daily on week days.
Initial download of the metrics may take a while.