| Issue |
A&A
Volume 706, February 2026
|
|
|---|---|---|
| Article Number | A252 | |
| Number of page(s) | 22 | |
| Section | Extragalactic astronomy | |
| DOI | https://doi.org/10.1051/0004-6361/202558053 | |
| Published online | 13 February 2026 | |
The Type Ia supernova 2021hem: A 2003fg-like event in an apparently hostless environment
1
Department of Physics and Astronomy, Aarhus University Ny Munkegade 120 DK-8000 Aarhus C, Denmark
2
Department of Astronomy, University of Michigan Ann Arbor MI 48109, USA
3
INAF – Osservatorio Astronomico di Padova Vicolo dell’Osservatorio 5 I-35122 Padova, Italy
4
Cosmic DAWN Center, Niels Bohr Institute, University of Copenhagen Lyngbyvej 2 2100 Copenhagen Ø, Denmark
5
Institute for Astronomy, University of Hawai’i 2680 Woodlawn Drive Honolulu HI 96822, USA
6
Observatories of the Carnegie Institution for Science 813 Santa Barbara St Pasadena CA 91101, USA
7
Space Telescope Science Institute 3700 San Martin Drive Baltimore MD 21218-2410, USA
8
Institute of Space Sciences (ICE, CSIC), Campus UAB, Carrer de Can Magrans s/n E-08193 Barcelona, Spain
9
Institut d’Estudis Espacials de Catalunya (IEEC) E-08034 Barcelona, Spain
10
Department of Physics, Florida State University 77 Chieftan Way Tallahassee FL 32306, USA
11
Department of Physics, Chalmers University of Technology SE-412 96 Göteborg, Sweden
12
European Southern Observatory Alonso de Córdova 3107 Casilla 19 Santiago, Chile
13
Planetary Science Institute, 1700 East Fort Lowell Road Suite 106 Tucson AZ 85719-2395, USA
14
CENTRA, Instituto Superior Técnico, Universidade de Lisboa Av. Rovisco Pais 1 1049-001 Lisboa, Portugal
15
Astronomical Observatory, University of Warsaw Al. Ujazdowskie 4 00-478 Warszawa, Poland
16
Cardiff Hub for Astrophysics Research and Technology, School of Physics & Astronomy, Cardiff University Queens Buildings The Parade Cardiff CF24 3AA, UK
17
Astrophysics Research Institute, Liverpool John Moores University, IC2, Liverpool Science Park 146 Brownlow Hill Liverpool L3 5RF, UK
18
School of Physics, Trinity College Dublin, The University of Dublin Dublin 2, Ireland
19
Instituto de Ciencias Exactas y Naturales (ICEN), Universidad Arturo Prat Iquique, Chile
20
The Oskar Klein Centre, Department of Physics, Stockholm University AlbaNova 10691 Stockholm, Sweden
21
INAF – Osservatorio Astronomico di Capodimonte Salita Moiariello 16 80131 Napoli, Italy
22
Steward Observatory, University of Arizona 933 North Cherry Avenue Tucson AZ 85721-0065, USA
★ Corresponding author: This email address is being protected from spambots. You need JavaScript enabled to view it.
, This email address is being protected from spambots. You need JavaScript enabled to view it.
Received:
10
November
2025
Accepted:
24
November
2025
Abstract
We report observations of a Type Ia supernova (SN Ia) 2021hem that was discovered within 48 hours of last nondetection and is located in an apparently hostless environment. With a peak absolute B-band magnitude of MB, max = −19.96 ± 0.29 mag, SN 2021hem lies at the luminous end of the SNe Ia distribution. Its near-infrared and i-band light curves lack the secondary maximum, which is otherwise ubiquitous to normal and 1991T-like SNe Ia. Instead, these properties cause SN 2021hem to closely resemble 2003fg-like events. The slowly evolving light curves (characterized by Δm15(B) = 1.02 ± 0.02 mag; sBV = 0.94 ± 0.05) and the earliest spectrum showing C IIλ6580 and λ7235 absorption lines further support this classification. Other spectroscopic features, including Si II line diagnostics, resemble those of normal SNe Ia. A fit of a fireball model to the early-time light curves yields a time of first light of tfirst = −16.43+0.45−0.38 days relative to B-band maximum. The first photometric detection occurs 1.51+0.45−0.38 days before the onset of fireball-like flux rise. This early emission, together with the intrinsic (g − r)0 color, is inconsistent with circumstellar or companion interaction. Instead, shallow 56Ni mixing or an asymmetric 56Ni distribution offers a plausible explanation for the delayed onset of the fireball flux rise, while a double-detonation scenario with a thin helium shell remains a less likely alternative. Notably, SN 2021hem represents the fifth known 2003fg-like SN that has early-time activity or excess flux emission. The estimated mass of radioactive 56Ni synthesized in SN 2021hem is 1.00 ± 0.09 M⊙. Deep GTC imaging obtained 2.5 years after the explosion, with an estimated limiting magnitude of mlim, r = 24.4 mag and a surface-brightness limit of μlim, r = 26.3 mag arcsec−2, revealed no coincident host. Most faint dwarf and ultradiffuse galaxies (UDGs) are therefore ruled out. Alternatively, if the nearest plausible AGN host galaxy located at a projected distance of 104 kpc is assumed, the progenitor would need to be a hypervelocity star ejected at ≈2200 km s−1 from the host by AGN interaction. A faint diffuse feature ≈6 kpc from the SN site has also been detected in the GTC image, and its surface brightness is within the limits of UDGs. It is unclear whether it is a galaxy and is associated with SN 2021hem, however. Based on its large normalized directional light distance (dDLR ≈ 3 − 4) from the SN and its unusual elongation, the probability that this is the candidate host galaxy of SN 2021hem is low. These results identify SN 2021hem as one of the strongest candidates for a hostless SN Ia and underscore the diversity of luminous slowly evolving 2003fg-like explosions and the wide range of environments in which they may occur.
Key words: supernovae: general / supernovae: individual: 2021hem
© The Authors 2026
 Open Access article, published by EDP Sciences, under the terms of the Creative Commons Attribution License (https://creativecommons.org/licenses/by/4.0), which permits unrestricted use, distribution, and reproduction in any medium, provided the original work is properly cited.
This article is published in open access under the Subscribe to Open model. This email address is being protected from spambots. You need JavaScript enabled to view it. to support open access publication.
1. Introduction
Type Ia supernovae (SNe Ia) are thermonuclear explosions of carbon–oxygen white dwarfs (WDs) that are generally thought to occur when the progenitor approaches the Chandrasekhar mass limit of ≈1.4 M⊙ (Nomoto et al. 1984; Hillebrandt & Niemeyer 2000). Their relative uniform peak luminosity has made them indispensable as cosmological distance indicators (Riess et al. 1998; Perlmutter et al. 1999). Beyond the population of normal SNe Ia, several distinct subclasses have been identified, including the low-luminosity 1991bg-like events (e.g., Filippenko et al. 1992a; Leibundgut et al. 1993), the overluminous 1991T-like SNe (e.g., Filippenko et al. 1992b; Phillips et al. 1992, 2024), and the exceptionally bright 2003fg-like explosions (Howell et al. 2006). Additional peculiar subtypes have also been recognized, such as the 2002cx-like (commonly referred to as SNe Iax; Li et al. 2003; Foley et al. 2013) and the 2002es-like SNe (e.g., Ganeshalingam et al. 2012; Bose et al. 2025).
The 2003fg-like events are one of the rarest SNe Ia subtypes (Howell et al. 2006; Hicken et al. 2007) and are historically referred to as “super-Chandrasekhar” SNe Ia. These objects exhibit broad, slowly declining light curves and peak luminosities that exceed those of normal SNe Ia with comparable decline rates. They also lack the secondary maximum in near-infrared (NIR) light curves that typically characterizes normal or luminous 1991T-like SNe while often displaying several distinctive features. These include low expansion velocities, a prominent C IIλ6580 absorption feature near maximum light, and early light curves with a short-lived flux excess that might arise from interaction with circumstellar material. Furthermore, their relatively low expansion velocities are consistent with high ejecta masses despite their high luminosities (Howell et al. 2006; Taubenberger et al. 2011; Scalzo et al. 2010). This led to the interpretation that they originate from super-Chandrasekhar-mass WD progenitors. Some 2003fg-like SNe have inferred ejecta masses within the Chandrasekhar-mass limit (see Chakradhari et al. 2014; Lu et al. 2021), however, which suggests a diversity in progenitor systems. The requirement for high ejecta masses in these events might also be satisfied by the merger of two near-Chandrasekhar-mass WDs (e.g., Dimitriadis et al. 2023). Alternatively, CSM-interaction models have been invoked to explain the high luminosity in several 2003fg-like SNe (e.g., Hachinger et al. 2012; Hsiao et al. 2020; Nagao et al. 2024; Bhattacharjee et al. 2025). Many 2003fg-like SNe also show a tendency to occur in low-mass often metal-poor dwarf host galaxies (Childress et al. 2011; Khan et al. 2011), although studies based on larger samples indicate that these events can arise in hosts spanning a wide range of masses (Dimitriadis et al. 2025; Bhattacharjee et al. 2025).
Supernovae Ia occur in a wide range of galactic environments, extending from star-forming spirals to quiescent ellipticals, and even within dense galaxy clusters, where intracluster stars might serve as progenitors (Sullivan et al. 2006; Lampeitl et al. 2010; Pan et al. 2014). While the majority of SNe Ia are clearly associated with galaxies, a small fraction appears to lack a host-galaxy association. Only a handful of confirmed SNe Ia to date have been identified in the intracluster regions of galaxy clusters. They are located far from any cluster members and likely originated from the intracluster stellar population (Gal-Yam et al. 2003; Sand et al. 2011; Graham et al. 2015). In principle, “hostless” SNe might also arise from hypervelocity stars that escaped their host galaxies prior to explosion. No confirmed examples of this scenario have been reported to date, however. Many candidates labeled as hostless in imaging surveys might in fact be associated with low surface brightness dwarf galaxies that remained undetected at the imaging depth of the survey (e.g., Strolger et al. 2002, 2025). This underscores the need for deep imaging to robustly confirm truly hostless SNe.
The Type Ia SN 2021hem (ZTF21aaqwjlz) provides an important case of this phenomenon. The absence of a clear host galaxy or any nearby cluster in its field raises the question of whether the explosion was truly hostless or associated with a system below the current detection limits. This possibility connects naturally to the population of low surface brightness galaxies. Ultradiffuse galaxies (UDGs) with effective radii of reff ≳ 1.5 kpc, low stellar masses of ∼108 M⊙ and a central surface brightnesses of ∼24 − 26.5 mag arcsec−2 have been identified in clusters, groups, and lower-density environments (van Dokkum et al. 2015; Koda et al. 2015; Muñoz et al. 2015; Mihos et al. 2015; van der Burg et al. 2016; Román & Trujillo 2017; Janssens et al. 2017; van der Burg et al. 2017). At even fainter extremes lie the ultrafaint dwarf galaxies (UFDGs) with luminosities as low as MV ∼ −1 to −8 and surface brightnesses μV ∼ 27 − 31 mag arcsec−2. These make them some of the most diffuse known stellar systems (Willman et al. 2005; Belokurov et al. 2007; McConnachie 2012; Drlica-Wagner et al. 2015; Torrealba et al. 2019; Simon 2019; Collins et al. 2022). They are typically comparable in size to globular clusters, with radii ranging from 30 to 70 pc, although a few larger objects can extend to a few hundred parsecs. Unlike globular clusters, however, UFDs contain several orders of magnitude fewer stars and exhibit higher velocity dispersions of 2−10 km s−1. They therefore are some of the most dark-matter dominated galactic systems (Revaz 2023). Because of their low surface brightness and small sizes, UFDGs cannot be detected beyond ≈10 Mpc, even with 10 m class telescopes with seeing conditions below an arcsecond. The most distant UFDG identified so far was found in Hubble Space Telescope imaging and lies at ≈19 Mpc (Lee et al. 2017). Nevertheless, owing to their extreme faintness, these galaxies always remain plausible hosts for otherwise “hostless” supernovae.
We report follow-up data on SN 2021hem that were obtained from shortly after explosion through over a month beyond peak brightness in an apparently hostless environment. This case illustrates the challenges of identifying the faintest hosts and probing the extremely low-luminosity galaxy population. Recent results from the ELEPHANT project indicated that fewer than ≈2% of the extragalactic transients are potentially hostless (Pessi et al. 2024). This highlights the need for deeper surveys to identify these rare events with better certainty.
The paper is organized as follows. Sect. 2 summarizes the discovery and classification. Sect. 3 describes the photometric and spectroscopic datasets, reductions, deep late-time imaging, and reddening and redshift estimates. Sect. 4 presents the light-curve analysis and spectroscopic diagnostics. Sect. 5 details the search for an underlying host. We derive the point-source and surface-brightness limits and note a nearby diffuse feature. Finally, Sect. 6 concludes with a brief summary.
2. Discovery and classification
SN 2021hem was identified by ALeRCE (Automatic Learning for the Rapid Classification of Events) broker system with J2000 coordinates RA =  and Dec =
  (Forster et al. 2021). This discovery was made possible with ALeRCE’s stamp classifier (Carrasco-Davis et al. 2021), utilizing data from the Zwicky Transient Facility (ZTF; Bellm et al. 2019) public data stream. According to the Transient Name Server (TNS) discovery certificate, the first detection of the object appeared in an rZTF-band image taken on 2021-03-24T10:05:20.00 UT and the last nondetection was obtained 45 hours earlier (i.e., 2021-03-22T11:33:32 UT). Making use of the ZTF forced photometry service (Masci et al. 2023), we recomputed photometry of the ZTF data stream which indicates that at the time of discovery of SN 2021hem had an rztf-band magnitude of 19.9, while the limiting magnitude of the nondetection image was 20.12 mag.
An optical spectrum obtained with the 6.5-m MMT Observatory equipped with Binospec on 2021-04-01T09:33:20 allowed Terreran (2021) to classify SN 2021hem as a SN Ia. They also reported a redshift of z = 0.035, presumably inferred from spectral template comparisons.
Based on the initial ZTF public stream data and demonstrated by the finding chart provided in Fig. 1, SN 2021hem appears to lack an associated host galaxy. This motivated our team to conduct a follow-up campaign covering the early photospheric phase evolution.
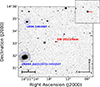 |
Fig. 1. r-band image of SN 2021hem at peak brightness observed with the Nordic Optical Telescope. The location of SN 2021hem is positioned at the center in both panels. Two of the closest cataloged galaxies are marked in blue, both at the projected distance of roughly 100 kpc (see Sect. 5.1). |
3. Observations
3.1. Supernova data
Our characterization of the photometric properties of SN 2021hem is based on a collection of photospheric phase optical BgVri- and near-IR JH-band photometry. During the course of the follow-up campaign, 22 epochs of optical imaging were obtained with the Las Cumbres Observatory’s Global Network of 1-m robotic telescopes and a single epoch with the Nordic Optical Telescope (NOT) equipped with the Alhambra Faint Object Spectrograph and Camera (ALFOSC). Two epochs of the JH-band imaging were also obtained with the NOT, equipped with the NOT near-infrared Camera and spectrograph (+NOTcam), while an additional epoch of JH-band imaging was obtained with the New Technology Telescope (NTT) equipped with the Son OF ISAAC (Sofi).
The optical and NIR imaging datasets were reduced following standard procedures. PSF photometry was computed for the SN using the FLOWS1 photometry pipeline, with nightly zeropoints computed relative to stars in the field with ATLAS Refcat2 catalog magnitudes (Tonry et al. 2018a).
Our Las Cumbres photometry is complemented by the ZTF public data stream, and Pan-STARRS photometry through Young Supernova Experiment (YSE; Jones et al. 2021). The ZTF forced photometry service was used to compute up-to-date photometry, and we ensured the implementation of the baseline correction (see Masci et al. 2023, for details). This data provides high cadence photometry beginning from around the time of first light (hereafter tfirst; see Sect. 4.1.2) and extending though the primary maximum. Finally, for completeness, we also ingested o- and c-band forced photometry from The Atlas Project (Tonry et al. 2018b; Shingles et al. 2021). The photometry measurements are listed in Tables A.1 and A.2.
In addition to the classification spectrum available on TNS (Transient Name Server), we obtained, in coordination with NUTS2 (NOT Unbiased Transient Survey), five optical spectra with the NOT (+ALFOSC), as well as a single spectrum with the APO 3.5-m (+DIS, dual imaging spectrograph). The NOT data were reduced following standard procedures using a software graphical user interface written in pyraf. Nightly sensitivity functions were computed based on the observations of at least one nightly spectrophometric flux standard. Similar reductions were performed using IRAF packages on the APO data obtained with both red and blue gratings. Complementing the optical spectroscopic time-series is a single NIR spectrum of SN 2021hem obtained with the NASA IRTF (+SpecX) as part of The Hawaii Infrared Supernova Study (Medler et al. 2025) at around peak brightness. A journal of spectroscopic observations is provided in Table 1.
Journal of the spectroscopic observations.
3.2. Late-time deep imaging by GTC
To characterize the location of SN 2021hem, we obtained a sequence of r-band images with the Gran Telescopio CANARIAS (GTC) equipped with OSIRIS (Optical System for Imaging and low-Intermediate-Resolution Integrated Spectroscopy), ≈900 days after the explosion on 9 September 2023. At this phase, the SN is expected to be around ∼27 − 28 mag assuming SN 2011fe-like light curve, which is well below the detection limit of the image (see Sect. 5.2.1 for the precise estimate of the image limiting magnitude). In total, 7 individual images of 60 second integration time were obtained, along with a single image with a 15 second integration time.
The images were reduced using standard procedures with software based on the photutils package. Each image was bias-subtracted, flat-field corrected, and cleaned of cosmic rays. The images were then geometrically aligned and combined to produce a single science frame. This image is used in Sect. 5.2.1 to estimate the limiting magnitude of any potential underlying host galaxy.
3.3. Reddening
The Milky Way reddening color excess along the line-of-sight toward SN 2021hem is E(B − V)MW = 0.0501 ± 0.0034 mag (Schlafly & Finkbeiner 2011). The post-peak (B − V)0 color curve of SN 2021hem, after correcting for Milky Way reddening, is consistent with the intrinsic color-curve of the archetypal normal SN 2011fe as well as the subluminous SN 1991bg (see Fig. B.1), suggesting SN 2021hem suffered minimal host extinction. Further corroborating this, SN 2021hem spectra reveal no Na I D absorption at the redshift of the SN. The minimal host reddening is also consistent with the apparent hostless environment of the SN. Therefore, we adopted the previously stated Milky Way reddening value in our extinction correction for SN 2021hem. Assuming RV = 3.1, this corresponds to an AVtot = 0.155 ± 0.011 mag.
3.4. Redshift of SN 2021hem
Using the Supernova Identification (SNID) code (Tonry & Davis 1979; Blondin & Tonry 2007), we determined the redshift of SN 2021hem for each spectrum by comparing it to a library of supernova spectral templates. The individual redshift estimates, their associated uncertainties, and the corresponding rlap values – which quantify the quality of the spectral matches – are listed in Table 1. We computed a weighted mean redshift incorporating both the statistical uncertainties and the rlap values as quality weights, yielding a redshift of z = 0.0363 ± 0.0044. To account for potential systematic uncertainties in the SNID-based redshift estimates, arising from template mismatch, phase coverage limitations, and spectral quality, a systematic error floor of Δzsys = 0.002 is adopted (Blondin & Tonry 2007; Foley et al. 2009), which was added in quadrature to the statistical uncertainty. This yields a redshift estimate of z = 0.0363 ± 0.0049. This value is adopted in the following to apply redshift corrections and to compute the corresponding luminosity distance of DL = 165 ± 22 Mpc assuming a standard Planck cosmology (Planck Collaboration XIII 2016), and the equivalent distance modulus of 36.09 ± 0.29 mag. We note the potential bias in SNID template matching for a low velocity SN, which we discuss in detail in Sect. 4.3, and conclude that SN 2021hem is a normal velocity SN Ia and unlikely there is any significant bias in the determined redshift.
As a consistency check, we examine the redshift distribution of galaxies within the field of view of SN 2021hem, as shown in Fig. 2. The distribution reveals over-densities at redshifts of z ≈ 0.027, ≈0.035, as well as a weaker concentration at ≈0.050, suggesting the presence of three major galaxy groups along the line-of-sight to SN 2021hem. Given the redshift determined from SNID template matching, z = 0.0363, SN 2021hem is plausibly associated with the galaxy group at z ≈ 0.035.
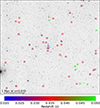 |
Fig. 2. Large-scale structure around the position of SN 2021hem (marked with a cyan cross) shown in a field with a size of 2 × 2 square degrees (DSS image). The colored circles indicate the galaxies with measured redshifts from the SIMBAD catalog within a redshift range of 0.02 to 0.05. The color bar indicates the redshifts for each color. There appears to be an overdensity of galaxies with redshifts close to z ≈ 0.027, ≈0.035 within a radius of 1 Mpc from the position of the SN. The open star symbol corresponds to the AGN galaxy 2MASX J16212572+1431537, which lies at a projected distance of 104 kpc from the SN. |
4. Results
4.1. Photometry
4.1.1. Light-curve properties and template fitting
The optical and NIR light curves of SN 2021hem, plotted relative to the epoch of B-band maximum, are shown in Fig. 3. The B-band maximum is estimated to have occurred on JD 2459316.46 ± 0.31, based on a direct Gaussian Process spline fit to the B-band light curve. This has been used as the reference epoch throughout the paper.
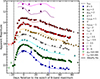 |
Fig. 3. Optical and NIR light curves of SN 2021hem, shown alongside the best-fit SNooPy template light curves using the max_model. Our own observations are shown with filled circles, and the photometry from ZTF, YSE, and ATLAS surveys is shown in different symbols. The SNooPy template fits are overplotted as solid lines; those in the gri bands are derived specifically from fits to the ZTF photometry. The indicated offsets have been added to the light curves for clarity. The vertical dashed line corresponds to the estimated “time of first light” by fitting a “fireball” model (see Sect. 4.1.2). |
Using spline fits, the estimated peak apparent magnitude is mB, max = 16.34 ± 0.01 mag, and the post-peak light curve decline is estimated to be Δm15(B) = 1.02 ± 0.02 mag. After correcting for Milky Way reddening, computed K-correction of −0.005 mag, and luminosity distance for the adopted redshift of z = 0.0363 ± 0.0049, the peak absolute magnitude of SN 2021hem is MB, max = −19.96 ± 0.29. On constructing (B − V)0 intrinsic color-curve with interpolated spline fits after correcting for reddening, the color-curve peaks at 28.3 ± 1.1 day, which corresponds to color-stretch parameter (Burns et al. 2014) sBV = 0.94 ± 0.05.
In Fig. 3, the observed light curve data points are overlaid with template fits generated using the SNooPy package (Burns et al. 2011), adopting the ‘max_model’ formalism. The ‘max_model’ in SNooPy fits the peak magnitude in each band directly by treating the maximum light in each filter as free parameters, while using the same template-driven time evolution (based on Δm15) and applying K-corrections and Milky Way extinction consistent with the ‘EBV_model’ framework. Unlike models that impose an explicit reddening law and intrinsic colors to simultaneously fit the multiband light curves, the max_model approach avoids specifying host-galaxy extinction and instead focuses on extracting peak brightnesses across all observed filters (see also Stritzinger et al. 2010, their Sect. 3 for details).
The ‘max_model’ provides fit parameters of the time of maximum as JD 2459316.74 ± 0.36 and a color-stretch parameter sBV = 1.19 ± 0.04. Table 2 provides results from direct GP splines to the optical light curves, and the estimated peak apparent magnitudes of the optical/NIR light curves estimated from the SNooPy ‘max_model’ fits, which include corrections for Milky Way reddening and computed K-correction. Adopting a redshift of z = 0.0363 ± 0.0049 for SN 2021hem (see Sect. 3.4), the peak apparent magnitudes computed by the ‘max_model’ indicate that it reached an absolute B-band peak magnitude of MB = −19.90 ± 0.29 mag, roughly half a magnitude brighter than typical SNe Ia of similar color-stretch values.
Light-curve fits.
Inspection of the light curves also reveals several notable features suggesting SN 2021hem is a peculiar object. First, the flux evolution from the discovery epoch to the next observation shows a short plateau in the early light-curve and deviates markedly from a power-law rise, which is analyzed in detail in Sect. 4.1.2. Second, the i-, J-, and H-band light curves lack secondary maxima and appear to be unusually flat compared to what expected from a typical SNe Ia or luminous 1991T-like SNe Ia. This is clearly reflected in the significant deviations between SN 2021hem and the SNooPy template light curve fits in these bands, which are drawn from normal SNe Ia based on Δm15(B). Additionally, the NIR bands are nearly as bright as the optical, in contrast to normal SNe Ia, where NIR absolute magnitudes are typically about one magnitude fainter. Taken together, these photometric peculiarities of SN 2021hem, along with high peak luminosity, makes it resemble other 2003fg-like SNe Ia.
Ashall et al. (2020) proposed a photometric classification scheme for SNe Ia based on the time difference between the i- and B-band maxima ( ) and the color-stretch parameter sBV. Using the B- and i-band peak dates listed in Table 2, we derive a rest-frame corrected value of
  days for SN 2021hem. Combined with the previously estimated sBV range of 0.94−1.19, obtained from both direct (B − V)0 color measurements and SNooPy fits, this places SN 2021hem among normal and luminous 1991T-like SNe Ia in the Ashall et al. (2020) classification diagram. In contrast, 2003fg-like subclasses occupy the region with
  in the same diagram (Ashall et al. 2021). Therefore, SN 2021hem lies marginally outside the parameter space of 2003fg-like SNe sample that populate the Ashall et al. (2020, 2021) classification diagram.
4.1.2. Estimating the time of first light, tfirst
We fit the rising portions of the ZTF g- and r-band light curves individually using an MCMC power-law model (see Fig. 4), following the methodology of Bose et al. (2025). The time of first light, tfirst, defined as the point when the SN luminosity begins a power-law rise, is estimated to be  days relative to the epoch of B-band maximum, with a corresponding power-law index α of
  form the ZTF r-band light curve. Similarly, using the ZTF g-band light curve, the estimated parameters are
  and
and  . The parameter estimates from the individual light curves are highly consistent, and we adopt their weighted mean as
  and
and  . This time of first light corresponds to JD
  .
.
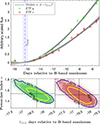 |
Fig. 4. Markov chain Monte Carlo power-law model fit to ZTF g and r-band fluxes to estimate the time of first light tfirst. The fitting is limited to the first 12 days after tfirst, during which the light curve clearly follows a power-law rise. Power-law model fits are performed separately on the ZTF g- and r-band light curves to determine tfirst and α independently for each band. In the top panel, the g- and r-band fluxes are shown with arbitrary and distinct scales for visual clarity. The inferred (weighted mean) tfirst is shown by a vertical dashed line, with the shaded region indicating the uncertainty limits. In the bottom panels, the vertical and horizontal lines indicate the tfirst and α values, as inferred from each MCMC fit. |
Interestingly, this epoch of tfirst occurs  days after the initial detection (JD ≈ 2459297.92) in the ZTF images. In fact, we repeated the MCMC fit excluding the detection epoch, and found the epoch of first detection is outside 99.9% confidence level of tfirst estimation. Visual inspection of both the r- and g-band ZTF images confirms the presence of a source at this time, as shown in Fig. 3, marking the first detection in both the ZTF g and r bands at ∼20 mags. This suggests that SN 2021hem emitted detectable radiation several days before its light curve began to follow the expected fireball expansion model.
The early SN atmosphere (≲7 day) can be well approximated as an optically thick “fireball” expanding homologously, and would result in a power-law flux rise (∝tα). Assuming a constant temperature would imply a power-law index of 2. Any variation in the power-law index would imply a deviation of energy transport within the ejecta, primarily due to nonuniformity of 56Ni mixing. Studies implementing the fireball model with early SNe Ia light curves have shown significant deviations from the classical fireball model power-law index of 2. A study on a sample of early TESS SNe Ia light curves (Fausnaugh et al. 2023) found a mean power-law index of 1.93 ± 0.57 with rise-time of 15.7 ± 3.5 days, whereas another study using SNe Ia in PTF and LSQ survey data (Firth et al. 2015) found a mean power-law index of 2.44 ± 0.13. In the case of SN 2020qxp/ASASSN-20jq, Bose et al. (2025) found a power-law index, which is almost exactly the same as the classical fireball model value of 2, indicating well-mixed 56Ni in the ejecta, which is also consistent with their non-LTE nebular-phase spectroscopic model that required macroscopic mixing to match observations.
Although the power-law index of 1.53 for SN 2021hem lies within the range found in previous studies, it is on the lower side of the distribution and is significantly below the classical value of 2. The low power-law index of SN 2021hem possibly implies the SN had a shallow 56Ni mixing, where the 56Ni is confined deeper in the ejecta, thus the early light-curve rises more slowly because photons take longer to diffuse to the photosphere.
As discussed above, the first photometric detections of SN 2021hem were made several days prior to the onset of the light curve’s power-law rise. One explanation for this pre-fireball emission is shallow 56Ni mixing, where radioactive heating occurs deeper in the ejecta. This results in a ‘dark phase’, during which tfirst is delayed by a few days after the explosion (see, e.g., Piro & Nakar 2013, 2014). This interpretation of the dark phase is consistent with the evidence for shallow 56Ni mixing discussed earlier in the context of the low power-law index. Another explanation for the delayed flux rise could be asymmetric distribution of 56Ni where the majority of 56Ni is on the far side of the explosion. This would appear to have the same effect as deeply embedded 56Ni leading to a dark phase. An alternative interpretation, proposed for MUSSES1604D (Jiang et al. 2017), which displayed an early ≈1 day plateau in its g-band light curve, involves a white dwarf undergoing a surface helium detonation, also referred to as an edge-lit detonation (e.g., Fink et al. 2010; Kromer et al. 2010). This surface detonation subsequently triggers a secondary detonation in the white dwarf core with a few days of delay, which can naturally explain the delayed fireball flux rise.
This pre-fireball emission should not be confused with the early flux excess seen in many early SNe Ia light curves, as the two phenomena are characteristically distinct. The early flux excess is typically attributed to the interaction of the SN ejecta with a nondegenerate companion star (Kasen 2010), or with circumstellar material (e.g., Piro & Morozova 2016; Maeda et al. 2023; Moriya et al. 2023; Stritzinger et al. 2018). It is estimated that approximately 20 − 30% of all SNe Ia exhibit such early-excess features (Magee et al. 2022; Deckers et al. 2022). In certain subclasses of SNe Ia, however, such as the peculiar 2002es-like, 2003fg-like, and luminous 1991T-like events, the occurrence rate of early-excess emission appears to be considerably higher (Jiang et al. 2018; Hoogendam et al. 2024). Crucially, unlike these early-excess signatures, the pre-fireball emission observed in SN 2021hem likely arises from a distinct physical mechanism, as discussed earlier. An early flux excess due to interaction typically emerges within a few days of explosion and appears superimposed on the power-law rise of the early light curve. This is because the short-lived excess flux from the interaction and the underlying “fireball” emission are both consequences of the expanding ejecta. In other words, the interaction cannot occur without the “fireball” expansion. In contrast, the early emission seen in SN 2021hem occurs even before the onset of the power-law flux rise of the fireball, clearly distinguishing it from the early excesses or bumps arising from interaction in other SNe Ia. Moreover, Jiang et al. (2017) argued, based on their models, that an early excess arising from interaction would inevitably show a blue color evolution, as was observed in the (B − V)0 color of SN iPTF14atg. Bulla et al. (2020) has also shown using ejecta-companion interaction models that the (g − r)0 colors at the time of interaction is expected to be ∼ − 0.5 mag. In the case of SN 2021hem the (g − r)0 color of 0.16 ± 0.33 mag, computed from first epoch of g and r-band light curves, does not show any blue excess. This color is broadly consistent with, or perhaps marginally redder than, the early (g − r)0 colors typically observed in normal SNe Ia (Bulla et al. 2020). Therefore, considering all these factors, the interaction scenario is disfavored for the pre-fireball emission seen in SN 2021hem.
Regardless of the origin, this early activity, which can be described as early flux excess or pre-fireball flux emission as in SN 2021hem, appears to be a ubiquitous feature among 2003fg-like SNe. In addition to SN 2021hem, other 2003fg-like supernovae with early-time observations and adequate photometric cadence – SNe 2020hvf, 2021zny, 2022ilv, and 2021qvo (Jiang et al. 2021; Hoogendam et al. 2024; Abreu Paniagua et al. 2025) – have all exhibited an early bump in their light curves.
4.1.3. Bolometric light curve and 56Ni mass
To estimate the quantity of 56Ni synthesized during the disruption of SN 2021hem, we constructed and modeled a UVOIR (ultraviolet–optical–infrared) bolometric light curve. Broad-band optical light curves were first interpolated using spline functions at coeval epochs. A total reddening correction of E(B − V)tot = 0.05 mag was applied (see Sect. 3.3). The bolometric flux was then estimated using the SNooPy package, with spectral templates from Hsiao et al. (2007) color-matched to the reddening-corrected broad-band colors of SN 2021hem. To account for flux outside the spectral range of the templates, we (i) extended the spectral energy distribution (SED) bluewards of the atmospheric cutoff by linearly extrapolating to zero flux at 1000 Å, and (ii) extended the redwards end of the SED beyond the i-band using a Rayleigh–Jeans tail extending to 25 000 Å. The integrated flux was then converted to bolometric luminosity using the distance adopted in Sect. 3.4. The resulting UVOIR bolometric light curve is shown in the top panel of Fig. 5.
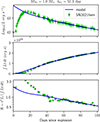 |
Fig. 5. UVOIR bolometric light curve of SN 2021hem fit with a radioactive 56Ni decay model. The time of explosion is taken as the epoch of first detection, which is ≈17.9 days before the B-band maximum. Only data beyond 60 days were used to fit the model. The UVOIR light curve of SN 2021hem (top panel), its time-weighted integrated luminosity (middle panel), and the ratio t2L/(∫Lt dt) (bottom panel), which is defined independently of the 56Ni mass, are shown. |
To estimate the 56Ni mass, the UVOIR light curve of SN 2021hem was fit with an energy-deposition model corresponding to the radioactive decay chain 56Ni → 56Co → 56Fe. The best-fitting model is overplotted on the UVOIR light curve in the top panel of Fig. 5. The model includes two free parameters: the synthesized 56Ni mass MNi and the γ-ray trapping timescale t0γ. We assumed complete deposition of the positron kinetic energy from 56Co decay, while the fraction of trapped γ-ray energy was modeled as [1−exp(−t0γ2/t2)]. At late epochs, when the contribution from positron energy becomes comparable to that of the deposited γ-ray energy, degeneracy arises between MNi and t0γ. To address this point, we examined the time-weighted integral of the luminosity (middle panel of Fig. 5). The result indicates that, at all times during the evolution of SN 2021hem, the energy budget can be fully explained by the 56Ni decay chain (Katz et al. 2013), with no indication from the model fit of any additional sources of energy input. The bottom panel of Fig. 5 shows the ratio t2L/∫Lt dt, which is defined to be independent of MNi, and therefore allows for an independent determination of t0γ (Katz et al. 2013). The model was fit only using data obtained beyond 60 days after explosion, when the ejecta is expected to be nearly optically thin and the luminosity is almost solely powered by radioactive decay. The best-fit parameters are t0γ = 51 ± 3 days and MNi = 1.0 ± 0.1 M⊙. The inferred 56Ni mass is significantly larger than those typically found in normal SNe Ia (e.g., Stritzinger et al. 2006; Scalzo et al. 2019; Sharon & Kushnir 2020), but is consistent with larger values inferred for 2003fg-like SNe Ia (e.g., Howell et al. 2006; Hicken et al. 2007; Kamiya et al. 2012; Chen et al. 2019).
4.2. Spectral properties, line diagnostics, and comparative analysis
Fig. 6 presents our montage of seven optical spectra of SN 2021hem, spanning from −10.2 to +33.8 days. The spectra reveal characteristic SNe Ia features with the shape of the continuum evolving from the blue to the red over time as the time-series tracks the temperature evolution of the underlying emission regions. Close inspection of the −10.2 days spectrum reveals a prevalent C IIλ6580 feature appearing in the red wing of the most prominent feature Si IIλ6355 (see line identifications in Fig. 7). Such a feature is estimated to occur in approximately 30% of SNe Ia (Parrent et al. 2011; Folatelli et al. 2012; Silverman & Filippenko 2012; Maguire et al. 2014) and is typically associated with the presence of unburned carbon. However, it appears to be ubiquitous among 2003fg-like SNe Ia (e.g., Hicken et al. 2007; Taubenberger et al. 2011; Ashall et al. 2021), which tend to have carbon-rich ejecta, and in some cases, it persists even beyond the time of maximum light (see below for more details). The measured pseudo-equivalent width (pEW) of the C II feature from the −10.2 days spectrum is ≈8.9 ± 2.5 Å. This is about a factor of 4 higher than that inferred from the normal SN 2011fe, and more consistent with values inferred from similar epoch spectra of the 2003fg-like SNe 2009dc and 2012dn (see Ashall et al. 2021; Lu et al. 2021). The measured velocity of C II is −vabs = 13800 ± 560 km s−1 is also in agreement with measurements inferred from similar epoch spectra of the 2003fg-like objects including SN 2009dc, ASASSN-15hy, and ASASSN-15pz (Ashall et al. 2021; Lu et al. 2021). We also identify the feature near 7000 Å likely to be C IIλ7235 line, which is roughly at a velocity consistent with the C IIλ6580 line. Beyond the C II features, the line features present in the time-series of SN 2021hem are consistent with many other normal SNe Ia.
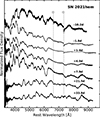 |
Fig. 6. Optical spectra of SN 2021hem from −10.2 days to +33.8 days relative to the epoch of B-band maximum. Spectra are shifted by arbitrary constants for clarity. Telluric absorption features are marked by dashed lines and labeled with the crossed circles. |
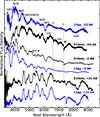 |
Fig. 7. Comparison of similar-phase spectra of the normal SN 2013gy and SN 2021hem. Telluric absorption features are marked by dashed lines and labeled with telluric symbols. Prominent spectral features in the pre-maximum light spectra are labeled. |
Figure 7 shows a comparison of SN 2021hem spectra at representative phases with those of the spectroscopically normal SN 2013gy (Holmbo et al. 2019). The comparison includes SN 2021hem’s earliest spectrum at −10.2 days, one near maximum light (−1.8 days), and another obtained approximately three weeks post-maximum. Key spectral features in the early-time spectra are labeled with their associated ions to aid in identification. Overall, SN 2021hem closely resembles SN 2013gy at all three epochs. The most notable difference is the presence of C II absorption in the pre-maximum spectra of SN 2021hem, which is absent in SN 2013gy.
We now examine the standard spectroscopic diagnostics used for SNe Ia to determine where SN 2021hem fits within the established subtypes. This includes measuring the pEWs of the Si IIλ5972 and λ6355 features, which enables classification according to the Branch et al. (2006) scheme. We also measure the Doppler expansion velocity of the Si IIλ6355 feature near maximum light, which provides insight into the ejecta kinematics.
The Branch diagram provides a quantitative framework for spectroscopic classification, relying on the pEWs of the Si IIλ5972 and λ6355 absorption features. Within this parameter space, SNe Ia are distributed into four principal subgroups: Core Normal (CN), Broad Line (BL), Cool (CL), and Shallow Silicon (SS), which reflect systematic variations in line strength and effective photospheric temperature (Nugent et al. 1995). The pEWs values of the Si IIλ5972 and λ6355 were measured from the −1.8 days spectrum by performing Gaussian fits, yielding values of 21.8 ± 1.8 Å and 111.2 ± 1.0 Å, respectively. These values place SN 2021hem firmly within the Branch diagram’s “core normal” subclass. 2003fg-like SNe are mostly associated with the “shallow silicon” group in the Branch diagram, while a few, for example, SNe 2012dn and CSS140501, are found to be associated with the “core normal” group (Ashall et al. 2021). SN 2021hem has Si II pEWs larger than any of these SNe, however, which further highlights the diversity among 2003fg-like SNe.
Using the SNIaDCA2 code from Burrow et al. (2020), we find that SN 2021hem has an > 85% likelihood of belonging to the “core-normal” group. When additional components (i.e., vSi II and MB) are included in the clustering analysis, the probability of SN 2021hem belonging to the “cool”-equivalent group increases dramatically. See Appendix C for further details on the probabilistic placement of SN 2021hem within these multidimensional clusters.
Following the Wang et al. (2009) framework, SNe Ia can be categorized as high-velocity (HV), with a blueshifted Doppler line velocities inferred from the position of maximum absorption (hereafter −vabs) of the Si II line with −vabs ≳ 11 800 km s−1, or otherwise “normal”, which populate a narrow strip in the Si II velocity distribution, with an average −vabs ≈ 10 600 ± 400 km s−1. Turning to SN 2021hem, we infer from the Si II absorption component in the −10.2 days spectrum −vabs ≈ 12 500 ± 300 km s−1. This decreases to 11 200 ± 400 km s−1 by −1.8 days, and further declines to 9200 ± 300 km s−1 by +33.8 days. The velocity achieved around maximum is consistent with SN 2021hem being a normal SN Ia within the classification framework of Wang et al. (2009). Figure 8 compares the Si IIλ6355 velocity evolution of SN 2021hem with a sample of 2003fg-like SNe from Ashall et al. (2021). The velocity evolution is consistent with other 2003fg-like SNe, and particularly identical to SN 2012dn.
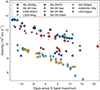 |
Fig. 8. Si IIλ6355 velocity evolution of SN 2021hem compared with the evolutions of other 2003fg-like SNe Ia. |
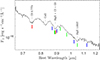 |
Fig. 9. −0.5 d NIR spectrum of SN 2021hem obtained with the NASA IRFT telescope equipped with SpeX. The prominent identified lines are labeled. The vertical red, green, and blue lines mark the positions for O I, Mg II, and C I lines respectively, where all lines for a given atomic species are at the same velocity. The O I (red) λ0.7774, λ0.9266 μm lines are at 10 500 km s−1, Mg II (green) λλ0.9218, 0.9244, λ0.9632, λ1.0092, λ1.0927 μm lines are at 11 700 km s−1, and C I (blue) λ0.9093, λ0.9406, λ1.0693, λ1.1754 μm lines are at 12 500 km s−1. Strong lines of Mg II and O I are identified, whereas for C I no prominent line identification is found, the C I line positions are shown at a tentative velocity of ≈12 500 km s−1. |
Figure 9 presents the single NIR spectrum obtained at −0.5 days with the NASA IRTF equipped with SpeX. The most prominent feature, located just redward of 1.0 μm, is identified as Mg II 1.0927 μm, with a measured pEW = 53.5 ± 5.6 Å and absorption velocity of −vabs = 11 700 ± 200 km s−1. Common lines features of O Iλ0.7774 μm, and Ca II NIR triplet are present. Another prominent feature near 0.9 μm is visible, which is primarily dominated by λλ0.9218, 0.9244 μm blended with O Iλ0.9266 μm and also possibly C Iλ0.9406 μm. No clear identification of C I lines was possible in the spectrum, as C I lines are usually stronger in 2003fg-like SNe at early times, and tend to become weaker near maximum. This is also consistent with the absence of C II in optical spectra of SN 2021hem near maximum light. However, in Fig. 9, the line positions of C I lines are marked at a tentative velocity of −vabs = 12 500 km s−1. Some weak features may be associated with the C I line positions in the figure, however, the signal-to-noise ratio level of the spectrum limits any conclusive identification.
In summary, the spectroscopic line diagnostics of SN 2021hem are aligned with spectroscopically normal SNe Ia, except for the relatively prevalent C II line present in our earliest optical spectrum, which is commonly seen in 2003fg-like SNe. The conclusion drawn from our near maximum-light spectra of SN 2021hem is consistent with many 2003fg-like SNe, as at this phase often these objects are spectroscopically indistinguishable from normal SNe Ia (see Sect. 6 of Ashall et al. 2021).
4.3. Revisiting redshift measurement and potential biases
It is important to note that all absorption-minimum velocities quoted in this section include an additional systematic uncertainty of Δvsys = ±1500 km s−1, propagated from the uncertainty in the redshift adopted in Sect. 3.4. 2003fg-like SNe exhibit a range of Si II velocities, from relatively low values of ≈8000 km s−1 (e.g. Howell et al. 2006; Yamanaka et al. 2009) to more typical SNe Ia-like values up to ≈12 000 km s−1 (e.g. Hicken et al. 2007). Since the SN 2021hem redshift was estimated by matching SN Ia spectral templates using SNID (see Sect. 3.4), an intrinsically low-velocity SN could be matched to a normal-velocity template, thereby biasing the inferred redshift toward higher values. This, in turn, could lead to an overestimation of the absorption-minimum velocities from spectra corrected to rest-wavelength using the biased redshift. On the other hand, no significant bias is expected in template matching if the SN is intrinsically a normal velocity SN, which is on the higher end of 2003fg-like SNe velocities. Based on the analysis done so far, SN 2021hem appear to be an SN in the normal velocity range, yet, we are unsure if the measurements are biased by overestimated redshifts.
To investigate this potential bias, we examine the Si IIλ6355 absorption line FWHM. The FWHM velocity (vFWHM) can be used as a tracer of the line velocity and is almost independent of the redshift correction applied to the spectrum. This may provide a clue whether SN 2021hem is intrinsically a normal-velocity or low-velocity 2003fg-like SN. Although the vFWHM may not be mapped directly to absorption-minima velocity, it can serve as a proxy to relate with absorption-minima velocity. We measure both the Si IIλ6355 −vabs and vFWHM for a number of 2003fg-like SNe spanning a range of velocities. As until the maximum light Si IIλ6355 line might be contaminated by the C II line, we use coeval post-maximum spectra for this diagnostic. In the case of SN 2009dc at +4.5 days, −vabs = 7300 ± 150 km s−1 and vFWHM = 5300 ± 200 km s−1; for ASASSN-15hy at +4.2 days, −vabs = 7900 ± 150 km s−1 and vFWHM = 5900 ± 200 km s−1; for LSQ14fmg at +3.6 days, −vabs = 10 400 ± 200 km s−1 and vFWHM = 6300 ± 250 km s−1; and for SN 2012dn at +3.9 days, −vabs = 10 500 ± 200 km s−1 and vFWHM = 6400 ± 250 km s−1. These values show a monotonic relation between −vabs and vFWHM. Now turning to SN 2021hem the estimated velocities for +3.9 days spectrum are −vabs = 11 000 ± 350 km s−1 and vFWHM = 8600 ± 250 km s−1. In the case of SN 2021hem, the measured vFWHM is consistent with that of normal and higher-velocity 2003fg-like SNe. In fact, vFWHM of SN 2021hem exceeds that of any of the measured 2003fg-like SNe, likely due to its extended blue-wing in the absorption line profiles, a feature not observed in any of the comparison objects. However, this analysis indicates that SN 2021hem is not an intrinsically low-velocity 2003fg-like SN, and therefore it is unlikely that the SNID-based redshift estimate is affected by a significant systematic overestimate.
5. Search for the host galaxy
One of the most intriguing aspects of SN 2021hem is its apparently hostless environment. SNe Ia are known to occur in a wide variety of galaxies and environments (Sullivan et al. 2006; Lampeitl et al. 2010; Pan et al. 2014), including stellar populations within galaxy clusters, which have been stripped from their hosts through tidal interactions and/or merger events. Only a handful of such intracluster SNe Ia have been identified to date (Gal-Yam et al. 2003; Sand et al. 2011; Graham et al. 2015). In the case of SN 2021hem, no nearby galaxy cluster is present in the field, making its origin from an intracluster star unlikely, although this possibility cannot be excluded. Strolger et al. (2025) investigated the likely origins of SNe Ia that appear to lack associated host galaxies, particularly those occurring in open-field, nonclustered environments, and suggested that many of these seemingly hostless events are actually associated with faint dwarf galaxies that remain undetected in wide-field surveys due to shallow limited imaging depth.
This section examines whether SN 2021hem originated from a hypervelocity progenitor that traveled far from its parent galaxy, or alternatively from an undetected low-luminosity host galaxy.
5.1. A runaway progenitor from its host
Unlike core-collapse SNe, SNe Ia exhibit long explosion delay times, typically ranging from ∼100 Myr to several Gyr, with a delay-time distribution that follows approximately t−1 (Totani et al. 2008; Maoz & Mannucci 2012). In principle, such timescales allow a hypervelocity progenitor to travel several hundred kiloparsecs from its host galaxy prior to explosion. To date, however, no confirmed case of a hypervelocity progenitor has been identified.
Assuming SN 2021hem originated from a hypervelocity runaway star (or binary system), we searched for known or visible galaxies in the vicinity of SN 2021hem as a plausible host. Two of the galaxies have been identified from the SIMBAD (Wenger et al. 2000) catalog as the closest and equidistant candidates from SN 2021hem (see Fig. 1). One is an elliptical galaxy LEDA 1461683 ( ;
;  ) at z = 0.02873, and a projected distance of 102 kpc. The other is a LINER-type Active Galaxy Nucleus (AGN), 2MASX J16212572+1431537 (
 ;
;  ), which is at a similar projected distance of 104 kpc and redshift of z = 0.02952. Although both of these galaxy redshifts differ from the plausible galaxy group redshift of z ≈ 0.035 or the adopted SN redshift of 0.0363 as inferred in Sect. 3.4, such a discrepancy could be explained if the progenitor were a hypervelocity star. A star with a line-of-sight velocity of ≈2000 km s−1 would account for the higher observed redshift. As an interesting side note, considering the redshift and projected line-of-sight velocity of the star in this scenario, after accounting for reddening, luminosity distance, and K-correction, the absolute rest-frame magnitude of SN 2021hem would be MB = −19.45 mag.
Based on their redshifts and projected separation from the SN position, both galaxies are, in principle, equally plausible hosts of SN 2021hem. Considerations of galaxy type and morphology suggest, however, that the AGN host is significantly more likely to produce a hypervelocity star. The size of the AGN galaxy is roughly ≈2.3 times that of the other elliptical galaxy, implying a larger stellar halo and also a smaller normalized directional light distance to SN 2021hem. Thus making the AGN galaxy the higher probability candidate among the two, to be the associated host of SN 2021hem. Although AGN jets or winds cannot directly accelerate compact, massive objects such as stars to extreme velocities, AGNs can facilitate the production of hypervelocity stars with speeds up to ≈4000 km s−1 via the Hills (1988) mechanism, in which a binary star system is disrupted by a supermassive black hole (SMBH) ejecting one of the members at high velocity. Additional channels are also possible, including star formation within the medium of AGN-driven outflows (Wang & Loeb 2018), or stellar ejection by interaction with binary SMBHs (Yu & Tremaine 2003; Darbha et al. 2019). Furthermore, AGN hosts typically exhibit significantly elevated star-formation rates, particularly in the central region (Gatto et al. 2025), which would naturally increase the number of stars available for dynamical interactions with the SMBH and thereby enhancing the expected production rate of hypervelocity stars. Considering these factors collectively, the AGN galaxy 2MASX J16212572+1431537 appears to be the most plausible origin of the hypervelocity progenitor (if such a scenario is assumed) of SN 2021hem.
Assuming a delay time of ≳100 Myr and the progenitor traveled a projected distance of 104 kpc from the AGN host, the projected transverse velocity is ≲1020 km s−1. This, combined with the line-of-sight velocity component of 2000 km s−1 (as discussed above), corresponds to an un-projected 3D velocity of ≲2240 km s−1. In comparison, the fastest known Galactic hypervelocity star is 1800 km s−1 (Koposov et al. 2020). A longer delay time can reduce the expected velocity of the hypervelocity progenitor. The adopted delay time of ≈100 Myr is at the lower limit, however, but is also the highest probable value as the delay time distribution roughly follows t−1. A lower redshift than that inferred for the SN would also lessen the required line-of-sight velocity component and, consequently, the net 3D velocity. Thus, assuming the minimum of ≈100 Myr delay time for SN 2021hem explosion, the required maximum velocity of the hypervelocity star is ≈2240 km s−1, which is only ≈400 km s−1 higher than the fastest known Galactic hypervelocity star, and is within the theoretical limit of fastest ejected stars by an AGN host.
5.2. An undetectable faint dwarf host
We also explored the possibility that the SN resides in a low-luminosity dwarf host too dim to be detected in archival data. Neither image analysis nor visual inspection revealed any trace of a host galaxy at the SN location, however, even in our deepest exposures. This makes it important to establish an upper limit on the host-galaxy brightness below which a source cannot be detected in our data.
5.2.1. Determining the limiting magnitude from the GTC image
We use the 435s r-band GTC image shown in Fig. 10, obtained approximately 900 days after the explosion, to determine the limiting magnitude. After processing the image following the standard reduction procedure, image quality parameters: stellar FWHM and ellipticity are measured with SExtractor, and median sigma clipping is applied to reject nonstellar sources. Aperture photometry is then performed using the photutils DaoPhot package. The image is calibrated using field stars cross-matched with the PanSTARRS r-band catalog (Flewelling et al. 2020), and the zeropoint magnitude for the image is determined to an uncertainty of 0.01 mag.
 |
Fig. 10. Image cutout centered on the position of SN 2021hem, taken on 9 September 2023 with the GTC equipped with OSIRIS. The final image is a stack of eight individual exposures, with a total integration time of 435 seconds. The location of the SN and the nearby diffuse extended feature is marked. An isophote is shown (green contour) enclosing the diffuse feature. |
To determine the limiting magnitude, an artificial test star of a given apparent magnitude is inserted near the SN location. Detectability is evaluated through 3σ-threshold source detection with SExtractor (Bertin & Arnouts 1996) within 0.5 ⋅ FWHM radius, followed by aperture photometry to assess recovered flux accuracy. A reference artificial star, fixed at 19 mag and placed in a region free of nearby field stars, is used to correct for flux loss due to fixed-aperture photometry. The procedure is repeated for 30 000 realizations, with test star apparent magnitudes drawn uniformly between 21.75 and 24.50 mag and positions randomized within a 4 ⋅ FWHM width ( ) square centered on the SN location. To improve computational efficiency and reduce the impact of large-scale background artifacts, a 500 pix cutout centered around the SN location is used.
The detection efficiency curves are plotted in the left panel of Fig. 11, where each curve corresponds to different tolerances of the recovered flux error with respect to the input artificial test star’s flux. For example, a 20% tolerance of recovered flux implies that a detection is considered true only if recovered flux is within 20% tolerance of its true flux of the artificial star. Similarly, the 99% tolerance curve implies the efficiency curve is almost solely determined if stars are detected above 3σ noise threshold. At the cutoff magnitude of mcutoff, r ≈ 24.05 mag, detection efficiency becomes zero for all the curves, as the test star is too faint to cross 3σ noise threshold at any location within  square area (as mentioned above).
 |
Fig. 11. Left: Detection efficiency as a function of magnitude with a 3σ detection threshold. Each curve is based on 30 000 simulated images, generated by adding an artificial star drawn from a uniform distribution over the magnitude range and within a 4 ⋅ FWHM square region around the SN position. The different curves correspond to varying tolerances between the recovered flux and the true flux of the input star. A detection is counted as successful if the recovered flux lies within the specified tolerance level of the input artificial star. Right: Same as left panel, but using 1σ detection threshold and 50 000 simulations within a magnitude range of 21.75 to 25.75 mag. |
Since we are primarily interested in the detectability of a source (host galaxy) near the SN location, irrespective of the accuracy of the measured flux, we look into the 99% tolerance curve at 50% efficiency to determine the limiting magnitude, and thus a value of mlim, r = 23.8 mag. This implies, assuming a point-source, any host associated with the SN is fainter than 23.8 mag, which translates to an absolute magnitude of −12.3 mag by adopting a luminosity distance for redshift of 0.0363.
It is important to emphasize that, in addition to image quality, the limiting magnitude we adopt also depends on the constraints imposed in our photometric workflow. The detection threshold is one of the primary parameters that governs the detectability of point sources. A second consideration is the definition of “sufficiently accurate” photometry, which we have already addressed through the generation of multiple efficiency curves for different tolerance levels (see Fig. 11), where each curve represents a different tolerance in accuracy of recovered flux. In most cases, a 3σ detection threshold provides a robust balance between accuracy and efficient detection, and this criterion was applied in the preceding analysis.
However, in this work, our primary interest lies in establishing the detectability of a possible host galaxy rather than obtaining reliable photometry of its features. For this purpose, a lower threshold is justified, and we find that a 1σ detection threshold represents a reasonable limit. For example, the faint diffuse feature highlighted in Fig. 10 (see Sect. 5.3) lies well below the 3σ noise level, but is detectable at 1σ level and also by visual inspection.
We therefore repeated the limiting-magnitude analysis using a 1σ detection threshold, with the results shown in the right panel of Fig. 11. The notable difference with a lower detection threshold is the fainter cutoff magnitude at mcutoff, r ≈ 25.50 mag, and the efficiency curves decline more gradually towards faint magnitudes. From the analysis with 1σ detection threshold, at 50% efficiency for the 99% tolerance curve, the limiting magnitude we find is mlim, r = 24.4 mag, or an absolute magnitude limit of −11.6 mag for any undetected galaxy.
5.2.2. Analytical estimate of the limiting magnitude
As a sanity check for the limiting magnitude estimated above, we attempt to analytically calculate the limiting magnitude for the image based on the detection threshold. Assuming a Gaussian stellar PSF, the 2D profile is
![Mathematical equation: $$ \begin{aligned} f(x,y) = h \cdot \exp {\left[-\frac{(x - \bar{x})^2}{2\sigma _x^2} - \frac{(y - \bar{y})^2}{2\sigma _y^2}\right]}, \end{aligned} $$](/articles/aa/full_html/2026/02/aa58053-25/aa58053-25-eq22.gif) (1)
(1)
where h is the amplitude of the Gaussian profile, and other symbols have their usual meanings. The volume of the 2D profile would be
 (2)
(2)
For a circular symmetric stellar PSF, σx = σy = σPSF. To satisfy a 3σ detection threshold, the amplitude h must be > 3σsky, where σsky is the local background sky-noise. Therefore, the limiting counts in ADU for the profile to satisfy the 3σ detection threshold,
 (3)
(3)
and on converting into limiting magnitude,
![Mathematical equation: $$ \begin{aligned} m_{\mathrm{lim}} = ZP - 2.5 \log _{10}\left[6\pi \sigma _{\rm sky}\sigma _{\rm PSF}^2\right], \end{aligned} $$](/articles/aa/full_html/2026/02/aa58053-25/aa58053-25-eq25.gif) (4)
(4)
where ZP is the image zeropoint magnitude for one ADU. Upon substituting the measured parameters for GTC image, σsky = 27.12 ADU estimated from a 3 ⋅ FWHM circular radius at the location of the SN, the σPSF = 1.95 pix measured for stellar PSF of the image, and the ZP = 32.61 mag, we estimate a limiting-magnitude, mlim = 24.38 mag. This is roughly consistent with the limiting magnitude cutoff obtained from simulation for the 3σ detection threshold limit, which is mcutoff ≈ 24.05 mag. In the case of a 1σ detection threshold, the corresponding value is mlim = 25.57 mag, which is very close to the magnitude cutoff of mcutoff ≈ 25.50 mag determined from 1σ threshold simulation.
5.2.3. Limiting magnitude in terms of surface brightness
In the case of extended objects like galaxies, the detection limit can be better described in terms of surface brightness. Assuming a circular aperture area Aap within which the flux for the estimated point-source limiting magnitude is confined, the limiting surface-brightness can be approximated to be fainter by 2.5log10(Aap) mag arcsec−2.
This limiting surface brightness should be regarded as an upper limit for the image. On considering a source that is extended over a larger area on the sky, the total integrated flux increases, while the noise per arcsec2 decreases by a factor of  due to averaging. Consequently, for extended objects such as galaxies, and also depending on their morphology, it becomes possible to detect objects with fainter surface brightness. For surface brightness measured for a extended source over an area of Asb, the S/N would scale up as
  , and the limiting surface-brightness would be fainter by a additional factor of 1.25log10(Asb/Aap) mag arcsec−2. Therefore, the limiting surface-brightness would be
 (5)
(5)
or
 (6)
(6)
or
 (7)
(7)
where FWHM is the point-source FWHM in arcsec, and Dsb is the diameter of the extended source in arcsec over which the surface-brightness is to be estimated. For our image, the equation reduces to μlim = mlim + 2.5log10(Dsb)−0.094.
Assuming 5 kpc effective diameter for a UDG-like host, the corresponding angular size at the redshift of the SN is  , and the limiting surface-brightness for the image is fainter by 1.9 mag arcsec−2 than the point source limiting magnitude. Adopting the 1σ point source limiting magnitude determined in Sect. 5.2.1, the limiting surface-brightness for a 5 kpc extended source near the SN location in the image is μlim, r = 26.3 mag arcsec−2.
There are a few caveats of this limiting surface-brightness estimate that should be noted. For a real galaxy, the limit of the surface brightness measurement would also be affected by the small-scale surface brightness variation of the galaxy. UDGs or UFDGs do not show much morphological diversity, however, and hence, they would not have a significant effect on our conversion. Second, when converting from a point source limiting magnitude to a surface-brightness limiting magnitude, we assume the sky background properties of the extended source, which contribute to detectability, are similar to those of the point source aperture and the sky annulus background. This also does not take into consideration the possible large variation in the sky background when an extended source area is being considered. This issue is somewhat mitigated, however, because in our point-source limiting magnitude simulation, we used a square area of  (3.8 kpc) width.
The above estimated limiting surface-brightness magnitude implies that a galaxy of diameter 5 kpc (or equivalent area) with 26.3 mag arcsec−2 surface-brightness is detectable to 1σ limit. Any galaxy of larger angular size can be detected even to a fainter surface brightness limit, and vice versa. In this calculation, we adopted the diameter of the extended source to be ≈5 kpc, which is roughly the median effective diameter found for UDGs (see e.g., Sifón et al. 2018). Having this limiting surface-brightness magnitude, we can rule out the possibility for almost all undetected UDGs as a host galaxy, except for the ones that are at the faintest end of UDG luminosity function 26.3 ≲ μ ≲ 26.5 mag arcsec−2. However, we cannot rule out the possibility of a UFDG-like host, which might have μ > 27 mag arcsec−2. Furthermore, UFDGs may have radii only up to a few hundred parsecs (Simon 2019), which would be a point source at our image resolution, and thus limited by point-source limiting magnitude of mlim, r = 24.4 mag.
5.3. A nearby faint diffuse feature
A faint, diffuse, and extended feature is detected in the deep GTC image at a projected distance of  (≈4.2 kpc) from the SN location, measured from its nearest edge (see Fig. 10). This feature is not visible in any of the archival images, nor in our shallow follow-up imaging. The feature extends
  (≈5.0 kpc) along its longest axis. Although its nature and possible association with the SN remain uncertain, photometry of the diffuse feature was performed using a polygonal region enclosing the entire structure (see Fig. B.2). For background estimation, a similarly shaped polygonal annulus of width 1.2 × FWHM was defined around the feature. Calibration was carried out using the zeropoint determined in the previous section. The integrated apparent magnitude of the feature is estimated as mr = 22.8 ± 1.8 mag, corresponding to an absolute magnitude of Mr = −13.2 ± 1.8 mag. Furthermore, the surface brightness of the feature was estimated by measuring its brightest regions (highlighted in red in Fig. B.2), yielding a value of μr = 25.58 ± 0.70 mag arcsec−2. This inferred value falls within the luminosity distribution of UDGs (e.g., van Dokkum et al. 2015; Koda et al. 2015; van der Burg et al. 2017; Newton et al. 2023). Together, these comparisons suggest that if the feature is indeed a galaxy, it would be broadly consistent with UDGs found residing within clusters. However, the feature appears to be unusually elongated and irregular in shape with its projected axis ratio of 0.25 ± 0.05. Typically, UDGs are not thin or flat disks, their shapes tend toward thick, spheroidal, or elongated spheroids rather than thin oblate disks (e.g., Mowla et al. 2017; Rong et al. 2020). Only a small number of UDGs, those in galaxy clusters, show distorted, elongated, or lopsided shapes due to tidal disruptions with a nearby massive galaxy (e.g., Marleau et al. 2021). In comparison, typical UDGs exhibit axis ratios in the range 0.4 − 0.9 with a median value of ≈0.7 (Burkert 2017; Rong et al. 2020). Therefore, the extreme elongation of the diffuse feature near SN 2021hem is unlikely for a UDG, and could potentially be only explained by tidal interactions with a nearby galaxy, yet no such companion is present in the immediate vicinity of the diffuse feature.
If we assume the feature is a galaxy, the projected distance of SN at ≈5.5 − 6.4 kpc from the center of the feature (or ≈4.2 kpc from the edge) is unusually high for it to be the associated host, when the small size of this galaxy, or if a typical UGD, is considered. We look into the normalized directional light distance dDLR of the SN (Sullivan et al. 2006; Gupta et al. 2016), which is a measure of the distance between the SN and the host galaxy, normalized to the physical extent of the host galaxy (directional radius of host) in the direction of the SN. For SN 2021hem and this feature, we measure dDLR to be  . The uncertainty attributed to the measurement is primarily due to the irregular shape of the feature and the region of confusion arising in considering the center of the host galaxy for measurement. This measure essentially means, the distance to the SN is roughly three to four times farther than the visible radius of the host galaxy. We compared this with the dDLR measurements of ≈1600 SNe from ZTF DR2 sample (Dimitriadis et al. 2025). The sample is cutoff to z < 0.06, to ensure higher volumetric completeness, and also found the bias in dDLR values towards higher redshift is minimal with this cutoff imposed as compared to the full sample. The comparison reveals that only ≈1.8 − 4.0% of SNe Ia in the sample have potential hosts that are further than the dDLR value measured between SN 2021hem and this diffused feature. It is to be noted that in ZTF DR2 sample, the potential hosts are identified based on the closest (dDLR) galaxy candidate identified from Pan-STARRS1 and Legacy imaging surveys, and no attempt was made to detect hosts fainter than survey depths. Therefore, it is possible that the true percentile of hosts above the given dDLR value could be even lower than inferred above.
Considering the large distance (dDLR) of the SN from the feature, and also the highly elongated and irregular shape of it, makes the diffuse feature a candidate of low probability to be the associated host of SN 2021hem. However, we cannot completely rule out that the diffuse feature is a galaxy, or if it is, its likelihood to be the associated host of SN 2021hem. If this is indeed the host of SN 2021hem, this would be the first SN detected in a UDG, and the progenitor has to be a high velocity star to reach this far before explosion. UGDs are low metallicity systems, and that favors being a host for 2003fg-like SNe. An alternative possibility could be that the diffuse feature is an unrelated background galaxy at a higher redshift.
6. Conclusions
The Type Ia SN 2021hem was discovered within 48 hours of the last nondetection in a ZTF survey, in an apparently hostless environment. The spectral template matching yielded a redshift of z = 0.0363 ± 0.0049, which is also consistent with an overdensity of similar redshift galaxies within a radius of ≈1 Mpc. Its peak absolute B-band magnitude of MB, max = −19.96 ± 0.29 mag places SN 2021hem at the bright end of the SN Ia luminosity distribution. Unlike normal or luminous 1991T-like SNe Ia, however, the i- and NIR-band light curves show no secondary maximum. This is a hallmark of low-luminosity 1991bg-like SNe Ia and some other peculiar subtypes. The high peak luminosity combined with the lack of a secondary maximum in the i- and NIR-band light curves suggests that SN 2021hem is a 2003fg-like SN Ia candidate.
The light curves of SN 2021hem evolve slowly and are characterized by shape parameters Δm15(B) = 1.02 ± 0.02 mag and sBV = 0.94 ± 0.05 mag. With these parameters, SN 2021hem is ≈0.3 mag brighter than typical SNe Ia in both the luminosity–width and luminosity–color–stretch relations. By fitting the radioactive decay model to the tail of the bolometric light curve of SN 2021hem, we estimated a high 56Ni mass of MNi = 1.00 ± 0.09 M⊙ and a gamma-ray trapping timescale of t0γ = 51 ± 3 day. This 56Ni mass is significantly higher than that of normal SNe Ia, but it is consistent with a more massive progenitor, as inferred for several other 2003fg-like SNe. The modeling of the time-weighted integral of the luminosity shows that the entire energy budget of the SN can be explained by the radioactive decay chain of 56Ni alone, without evidence of any significant additional energy source, such as circumstellar interaction.
The Si II velocity near maximum light is ≈11 200 km s−1, which is consistent with the normal-velocity class of SNe Ia as defined by Wang et al. (2009). The Si IIλ5972 and λ6355 line pEWs further place SN 2021hem within the core-normal subclass on the Branch diagram. Overall, the spectroscopic properties of SN 2021hem are consistent with those of normal SNe Ia. Notably, the earliest spectrum at −10.2 days reveals C IIλ6580 and λ7235 features at ≈13 800 km s−1. While the C II absorption lines are not commonly observed in normal SNe Ia, they are particularly prevalent among 2003fg-like events. The slowly evolving light curves paired with the luminosity, high inferred 56Ni mass, and the detection of C II lines in the early spectrum support the classification of SN 2021hem as a 2003fg-like SN Ia. Nevertheless, certain characteristics of SN 2021hem, such as its position within the normal SNe Ia parameter space ( vs. sBV) in the Ashall et al. (2020) classification diagram and its relatively large Si II pEWs compared to previously observed 2003fg-like SNe, indicate that SN 2021hem extends the observed diversity within this peculiar subclass.
The fitting of a power-law model, as expected for a homologously expanding “fireball”, to the early g- and r-band fluxes yielded a time of first light of  days relative to B-band maximum, with a power-law index of
  . One particularly interesting aspect of SN 2021hem is that the first photometric detection occurred
  days before (with 99.9% confidence) the onset of the power-law flux rise. Unlike the flux excesses seen in other SNe Ia, this behavior cannot be explained by interaction with circumstellar material or a companion alone, which would inevitably produce an additional flux component superimposed on the power-law flux rise of the fireball model. Moreover, an emission arising from CSM interaction is expected to show a blue color, whereas in SN 2021hem the (g − r)0 color of 0.16 ± 0.33 mag lacks any blue excess and is instead consistent with most typical SNe Ia early colors. A more plausible explanation for the observed pre-fireball emission is shallow 56Ni mixing, in which radioactive heating takes place deeper within the ejecta. This leads to a short dark phase, during which the fireball flux rise is delayed by a few days after the explosion. A shallow 56Ni mixing leading to slower radiation transport can also explain the lower inferred value of the power-law index α = 1.53, as compared to the classical fireball model value of 2. An asymmetric 56Ni distribution, which is concentrated on the far side of the explosion, might also lead to a similar dark phase.
A double-detonation model with an early helium flash can produce a short 1 − 2 day plateau in the early light curve in principle, as observed in MUSSES1604D (Jiang et al. 2017). A thin shell of a surface helium detonation might account for this early emission and might subsequently trigger a detonation in the core of the WD with a delay of a few days, thereby explaining the delayed onset of the fireball-like expansion light curve. However, a double-detonation scenario is only thought to be necessary for sub-Chandrasekhar mass WDs. In the case of SN 2021hem, a 2003fg-like event with a Chandrasekhar-mass WD already has a sufficiently high central density to initiate carbon ignition. Although it is theoretically possible for a double detonation with surface helium burning to occur in a Chandrasekhar-mass WD, no compelling observational evidence for this process has been found to date. This would instead likely lead to an accretion-induced collapse into a neutron star and not to a thermonuclear explosion. We therefore regard this as a less likely scenario.
Regardless of the physical process behind this pre-fireball flux or early emission, all 2003fg-like SNe with sufficiently early observations (SNe 2020hvf, 2021zny, 2022ilv, and 2021qvo) exhibit a similar early-time activity. SN 2021hem thus represents the fifth known event with this behavior, which underscores the importance of prompt high-cadence early observations to constrain the physical origin of early emission in these rare SNe Ia.
Another intriguing aspect of SN 2021hem is the absence of a clearly associated host galaxy. 2003fg-like SNe Ia discoveries tend to show a preference toward low-mass dwarf host galaxies (e.g., Childress et al. 2011; Taubenberger et al. 2013), but these SNe have been found in a range of host-galaxy types, from low-mass dwarfs to massive spiral galaxies (Dimitriadis et al. 2025; Bhattacharjee et al. 2025). To constrain the host and progenitor of SN 2021hem, various possibilities were thoroughly investigated. The nearest identified galaxy is an AGN and is located at a projected distance of 104 kpc, with a redshift of z = 0.02952. When we consider this as a plausible host, the progenitor might have been a hypervelocity star (or binary system) that was ejected from it and traveled far away before the explosion. An AGN host can facilitate the production of a hypervelocity progenitor. The transverse and radial velocity components of this runaway hypervelocity star might account for the large offset from the host galaxy and the redshift difference between the host and that inferred for the SN. When we assume an explosion delay time of 100 Myr for the SN, the estimated 3D unprojected velocity of this potential hypervelocity progenitor is ≈2200 km s−1.
The second possibility we explored was an undetected faint dwarf host. Deep GTC imaging obtained 2.5 years after the explosion revealed no host galaxy at the SN location. However, this observation allowed us to place an upper limit on any potentially undetected host and to interpret it in the context of the galaxy population. At the 1σ detection threshold, the point-source limiting magnitude was estimated as mlim, r = 24.4 mag and the limiting surface brightness as μlim, r = 26.3 mag arcsec−2. This surface brightness limit rules out nearly all galaxies within the known luminosity distribution, including most UDGs, except for those at the faintest end of the UDG luminosity function (26.3 ≲ μ ≲ 26.5 mag arcsec−2). Nonetheless, the existence of an UFDG host cannot be excluded. With their small sizes (∼30 − 70 pc) and extremely low surface brightness (μ > 27 mag arcsec−2), these galaxies might remain undetected even beyond distances of just ≈20 Mpc.
The deep GTC image revealed a faint, diffuse, and extended feature located at a projected distance of approximately ≈5.5 − 6.4 kpc from the SN position. Its absolute magnitude was measured as Mr = −13.2 ± 1.8 mag, with a surface brightness of μr = 25.58 ± 0.70 mag arcsec−2. It remains uncertain whether this feature is a galaxy associated with the SN. Nevertheless, its measured surface brightness places it within the luminosity regime of UDGs. The feature exhibits an unusually irregular and highly elongated morphology for a UDG in a cluster-free environment, however. Furthermore, the normalized directional light distance (dDLR) of SN 2021hem from this feature is substantially larger than that of the vast majority of observed SNe. A comparison with the ZTF DR2 sample indicated that fewer than 4.0% of SNe might have potential hosts located at large separations like this. If this feature is indeed a galaxy, it would be a candidate of significantly low probability based on these considerations, but it cannot be ruled out that this is the associated host of SN 2021hem. On the other hand, UDGs are low-metallicity systems, which would be a favorable host for a 2003fg-like SNe. If this is the associated host, then SN 2021hem would be the first SN to be found in any UDG.
When we take all these factors along with the limits we can place on any plausible undetected host galaxy into account, SN 2021hem remains one of the strongest candidates for a hostless supernova. The combined capabilities of the Vera C. Rubin Observatory Legacy Survey of Space and Time (LSST; Ivezić et al. 2019), La Silla Quest Survey 4 (LS4; Miller et al. 2025), and The ATLAS Project (Tonry et al. 2018b) will greatly broaden the discovery space for these rare events in the future.
Acknowledgments
We are grateful to Subo Dong for suggesting our team to follow-up SN 2021hem, Mark Phillips for discussions, and Morgran Fraser for observational support. Funding of the Aarhus supernova group during the creation of this research comes from grants via the Independent Research Fund Denmark (IRFD; grant numbers 8021-00170B and 10.46540/2032-00022B), and the Aarhus University Research Foundation (Nova project AUFF-E-2023-9-28). L.G. and C.P.G. recognize the support from the Spanish Ministerio de Ciencia e Innovación (MCIN) and the Agencia Estatal de Investigación (AEI) 10.13039/501100011033 under the PID2023-151307NB-I00 SNNEXT project, from Centro Superior de Investigaciones Científicas (CSIC) under the PIE project 20215AT016 and the program Unidad de Excelencia María de Maeztu CEX2020-001058-M, and from the Departament de Recerca i Universitats de la Generalitat de Catalunya through the 2021-SGR-01270 grant. C.P.G. acknowledges financial support from the Secretary of Universities and Research (Government of Catalonia) and by the Horizon 2020 Research and Innovation Programme of the European Union under the Marie Skłodowska-Curie and the Beatriu de Pinós 2021 BP 00168 programme. L.G. acknowledges financial support from AGAUR, CSIC, MCIN and AEI 10.13039/501100011033 under projects PID2023-151307NB-I00, PIE 20215AT016, ILINK23001, COOPB2304. Based on observations made with the Nordic Optical Telescope, owned in collaboration by the University of Turku and Aarhus University, and operated jointly by Aarhus University, the University of Turku and the University of Oslo, representing Denmark, Finland and Norway, the University of Iceland and Stockholm University at the Observatorio del Roque de los Muchachos, La Palma, Spain, of the Instituto de Astrofisica de Canarias. The NOT data were obtained under programme ID P62-505 and P66-506. Based on observations collected at the European Organisation for Astronomical Research in the Southern Hemisphere, Chile, as part of ePESSTO+ (the advanced Public ESO Spectroscopic Survey for Transient Objects Survey – PI: Inserra). ePESSTO+ observations were obtained under ESO program ID 1103.D-0328. T.E.M.B. is funded by Horizon Europe ERC grant no. 101125877. J. D. acknowledges support by FCT for CENTRA through the Project No. UIDB/00099/2025. J. D. also acknowledges support by FCT under the PhD grant 2023.01333.BD.
References
- Abreu Paniagua, I. A., Hoogendam, W. B., Jones, D. O., et al. 2025, ArXiv e-prints [arXiv:2508.13263] [Google Scholar]
- Ashall, C., Lu, J., Burns, C., et al. 2020, ApJ, 895, L3 [NASA ADS] [CrossRef] [Google Scholar]
- Ashall, C., Lu, J., Hsiao, E. Y., et al. 2021, ApJ, 922, 205 [NASA ADS] [CrossRef] [Google Scholar]
- Bellm, E. C., Kulkarni, S. R., Graham, M. J., et al. 2019, PASP, 131, 018002 [Google Scholar]
- Belokurov, V., Zucker, D. B., Evans, N. W., et al. 2007, ApJ, 654, 897 [Google Scholar]
- Bertin, E., & Arnouts, S. 1996, A&AS, 117, 393 [NASA ADS] [CrossRef] [EDP Sciences] [Google Scholar]
- Bhattacharjee, S., Pan, Y.-C., Miao, H.-Y., et al. 2025, MNRAS, 542, 2752 [Google Scholar]
- Blondin, S., & Tonry, J. L. 2007, ApJ, 666, 1024 [NASA ADS] [CrossRef] [Google Scholar]
- Bose, S., Stritzinger, M. D., Ashall, C., et al. 2025, A&A, 699, A169 [NASA ADS] [CrossRef] [EDP Sciences] [Google Scholar]
- Branch, D., Dang, L. C., Hall, N., et al. 2006, PASP, 118, 560 [NASA ADS] [CrossRef] [Google Scholar]
- Bulla, M., Miller, A. A., Yao, Y., et al. 2020, ApJ, 902, 48 [NASA ADS] [CrossRef] [Google Scholar]
- Burkert, A. 2017, ApJ, 838, 93 [NASA ADS] [CrossRef] [Google Scholar]
- Burns, C. R., Stritzinger, M., Phillips, M. M., et al. 2011, AJ, 141, 19 [Google Scholar]
- Burns, C. R., Stritzinger, M., Phillips, M. M., et al. 2014, ApJ, 789, 32 [Google Scholar]
- Burrow, A., Baron, E., Ashall, C., et al. 2020, ApJ, 901, 154 [NASA ADS] [CrossRef] [Google Scholar]
- Carrasco-Davis, R., Reyes, E., Valenzuela, C., et al. 2021, AJ, 162, 231 [NASA ADS] [CrossRef] [Google Scholar]
- Chakradhari, N. K., Sahu, D. K., Srivastav, S., & Anupama, G. C. 2014, MNRAS, 443, 1663 [NASA ADS] [CrossRef] [Google Scholar]
- Chen, P., Dong, S., Katz, B., et al. 2019, ApJ, 880, 35 [NASA ADS] [CrossRef] [Google Scholar]
- Childress, M., Aldering, G., Aragon, C., et al. 2011, ApJ, 733, 3 [NASA ADS] [CrossRef] [Google Scholar]
- Childress, M., Scalzo, R., Sim, S. A., et al. 2011, ApJ, 733, 3 [NASA ADS] [CrossRef] [Google Scholar]
- Collins, M. L. M., Drlica-Wagner, A., Bechtol, K., et al. 2022, ApJ, 924, 62 [NASA ADS] [CrossRef] [Google Scholar]
- Darbha, S., Coughlin, E. R., Kasen, D., & Quataert, E. 2019, MNRAS, 482, 2132 [NASA ADS] [CrossRef] [Google Scholar]
- Deckers, M., Maguire, K., Magee, M. R., et al. 2022, MNRAS, 512, 1317 [NASA ADS] [CrossRef] [Google Scholar]
- Dimitriadis, G., Maguire, K., Karambelkar, V. R., et al. 2023, MNRAS, 521, 1162 [NASA ADS] [CrossRef] [Google Scholar]
- Dimitriadis, G., Burgaz, U., Deckers, M., et al. 2025, A&A, 694, A10 [NASA ADS] [CrossRef] [EDP Sciences] [Google Scholar]
- Drlica-Wagner, A., Bechtol, K., Rykoff, E. S., et al. 2015, ApJ, 813, 109 [Google Scholar]
- Fausnaugh, M. M., Vallely, P. J., Tucker, M. A., et al. 2023, ApJ, 956, 108 [Google Scholar]
- Filippenko, A. V., Richmond, M. W., Branch, D., et al. 1992a, AJ, 104, 1543 [NASA ADS] [CrossRef] [Google Scholar]
- Filippenko, A. V., Richmond, M. W., Matheson, T., et al. 1992b, ApJ, 384, L15 [CrossRef] [Google Scholar]
- Fink, M., Röpke, F. K., Hillebrandt, W., et al. 2010, A&A, 514, A53 [NASA ADS] [CrossRef] [EDP Sciences] [Google Scholar]
- Firth, R. E., Sullivan, M., Gal-Yam, A., et al. 2015, MNRAS, 446, 3895 [NASA ADS] [CrossRef] [Google Scholar]
- Flewelling, H. A., Magnier, E. A., Chambers, K. C., et al. 2020, ApJS, 251, 7 [NASA ADS] [CrossRef] [Google Scholar]
- Folatelli, G., Phillips, M. M., Morrell, N., et al. 2012, ApJ, 745, 74 [Google Scholar]
- Foley, R. J., Matheson, T., Blondin, S., et al. 2009, AJ, 137, 3731 [Google Scholar]
- Foley, R. J., Challis, P. J., Chornock, R., et al. 2013, ApJ, 767, 57 [Google Scholar]
- Forster, F., Bauer, F. E., Pignata, G., et al. 2021, Transient Name Server Discovery Report, 2021-942, 1 [Google Scholar]
- Gal-Yam, A., Maoz, D., Guhathakurta, P., & Filippenko, A. V. 2003, AJ, 125, 1087 [Google Scholar]
- Ganeshalingam, M., Li, W., Filippenko, A. V., et al. 2012, ApJ, 751, 142 [NASA ADS] [CrossRef] [Google Scholar]
- Gatto, L., Storchi-Bergmann, T., Riffel, R. A., et al. 2025, MNRAS, 539, 3229 [Google Scholar]
- Graham, M. L., Sand, D. J., Zaritsky, D., & Pritchet, C. J. 2015, ApJ, 807, 83 [NASA ADS] [CrossRef] [Google Scholar]
- Gupta, R. R., Kuhlmann, S., Kovacs, E., et al. 2016, AJ, 152, 154 [NASA ADS] [CrossRef] [Google Scholar]
- Hachinger, S., Mazzali, P. A., Taubenberger, S., et al. 2012, MNRAS, 427, 2057 [NASA ADS] [CrossRef] [Google Scholar]
- Hicken, M., Garnavich, P. M., Prieto, J. L., et al. 2007, ApJ, 669, L17 [NASA ADS] [CrossRef] [Google Scholar]
- Hillebrandt, W., & Niemeyer, J. C. 2000, ARA&A, 38, 191 [Google Scholar]
- Hills, J. G. 1988, Nature, 331, 687 [Google Scholar]
- Holmbo, S., Stritzinger, M. D., Shappee, B. J., et al. 2019, A&A, 627, A174 [NASA ADS] [CrossRef] [EDP Sciences] [Google Scholar]
- Hoogendam, W. B., Shappee, B. J., Brown, P. J., et al. 2024, ApJ, 966, 139 [NASA ADS] [CrossRef] [Google Scholar]
- Howell, D. A., Sullivan, M., Nugent, P. E., et al. 2006, Nature, 443, 308 [Google Scholar]
- Hsiao, E. Y., Conley, A., Howell, D. A., et al. 2007, ApJ, 663, 1187 [Google Scholar]
- Hsiao, E. Y., Hoeflich, P., Ashall, C., et al. 2020, ApJ, 900, 140 [NASA ADS] [CrossRef] [Google Scholar]
- Ivezić, Ž., Kahn, S. M., Tyson, J. A., et al. 2019, ApJ, 873, 111 [Google Scholar]
- Janssens, S., Abraham, R., Brodie, J., et al. 2017, ApJ, 839, L17 [NASA ADS] [CrossRef] [Google Scholar]
- Jiang, J.-A., Doi, M., Maeda, K., et al. 2017, Nature, 550, 80 [CrossRef] [Google Scholar]
- Jiang, J.-A., Doi, M., Maeda, K., & Shigeyama, T. 2018, ApJ, 865, 149 [Google Scholar]
- Jiang, J.-A., Maeda, K., Kawabata, M., et al. 2021, ApJ, 923, L8 [NASA ADS] [CrossRef] [Google Scholar]
- Jones, D. O., Foley, R. J., Narayan, G., et al. 2021, ApJ, 908, 143 [NASA ADS] [CrossRef] [Google Scholar]
- Kamiya, Y., Tanaka, M., Nomoto, K., et al. 2012, ApJ, 756, 191 [Google Scholar]
- Kasen, D. 2010, ApJ, 708, 1025 [Google Scholar]
- Katz, B., Kushnir, D., & Dong, S. 2013, ArXiv e-prints [arXiv:1301.6766] [Google Scholar]
- Khan, R., Stanek, K. Z., Stoll, R., & Prieto, J. L. 2011, ApJ, 737, L24 [Google Scholar]
- Koda, J., Yagi, M., Yamanoi, H., & Komiyama, Y. 2015, ApJ, 807, L2 [NASA ADS] [CrossRef] [Google Scholar]
- Koposov, S. E., Boubert, D., Li, T. S., et al. 2020, MNRAS, 491, 2465 [Google Scholar]
- Kromer, M., Sim, S. A., Fink, M., et al. 2010, ApJ, 719, 1067 [Google Scholar]
- Lampeitl, H., Smith, M., Nichol, R. C., et al. 2010, ApJ, 722, 566 [Google Scholar]
- Lee, M. G., Jang, I. S., Beaton, R., et al. 2017, ApJ, 835, L27 [Google Scholar]
- Leibundgut, B., Kirshner, R. P., Phillips, M. M., et al. 1993, AJ, 105, 301 [NASA ADS] [CrossRef] [Google Scholar]
- Li, W., Filippenko, A. V., Chornock, R., et al. 2003, PASP, 115, 453 [Google Scholar]
- Lu, J., Ashall, C., Hsiao, E. Y., et al. 2021, ApJ, 920, 107 [NASA ADS] [CrossRef] [Google Scholar]
- Maeda, K., Jiang, J.-A., Doi, M., Kawabata, M., & Shigeyama, T. 2023, MNRAS, 521, 1897 [NASA ADS] [CrossRef] [Google Scholar]
- Magee, M. R., Cuddy, C., Maguire, K., et al. 2022, MNRAS, 513, 3035 [NASA ADS] [CrossRef] [Google Scholar]
- Maguire, K., Sullivan, M., Pan, Y. C., et al. 2014, MNRAS, 444, 3258 [NASA ADS] [CrossRef] [Google Scholar]
- Maoz, D., & Mannucci, F. 2012, PASA, 29, 447 [NASA ADS] [CrossRef] [Google Scholar]
- Marleau, F. R., Habas, R., Poulain, M., et al. 2021, A&A, 654, A105 [NASA ADS] [CrossRef] [EDP Sciences] [Google Scholar]
- Masci, F. J., Laher, R. R., Rusholme, B., et al. 2023, ArXiv e-prints [arXiv:2305.16279] [Google Scholar]
- McConnachie, A. W. 2012, AJ, 144, 4 [Google Scholar]
- Medler, K., Ashall, C., Shahbandeh, M., et al. 2025, ArXiv e-prints [arXiv:2505.18507] [Google Scholar]
- Mihos, J. C., Durrell, P. R., Ferrarese, L., et al. 2015, ApJ, 809, L21 [Google Scholar]
- Miller, A. A., Abrams, N. S., Aldering, G., et al. 2025, ArXiv e-prints [arXiv:2503.14579] [Google Scholar]
- Moriya, T. J., Mazzali, P. A., Ashall, C., & Pian, E. 2023, MNRAS, 522, 6035 [Google Scholar]
- Mowla, L., van Dokkum, P., Merritt, A., et al. 2017, ApJ, 851, 27 [CrossRef] [Google Scholar]
- Muñoz, R. P., Eigenthaler, P., Puzia, T. H., et al. 2015, ApJ, 813, L15 [Google Scholar]
- Nagao, T., Maeda, K., Mattila, S., et al. 2024, A&A, 687, L19 [NASA ADS] [CrossRef] [EDP Sciences] [Google Scholar]
- Newton, O., Di Cintio, A., Cardona-Barrero, S., et al. 2023, ApJ, 946, L37 [Google Scholar]
- Nomoto, K., Thielemann, F.-K., & Yokoi, K. 1984, ApJ, 286, 644 [NASA ADS] [CrossRef] [Google Scholar]
- Nugent, P., Phillips, M., Baron, E., Branch, D., & Hauschildt, P. 1995, ApJ, 455, L147 [NASA ADS] [CrossRef] [Google Scholar]
- Pan, Y. C., Sullivan, M., Maguire, K., et al. 2014, MNRAS, 438, 1391 [NASA ADS] [CrossRef] [Google Scholar]
- Parrent, J. T., Thomas, R. C., Fesen, R. A., et al. 2011, ApJ, 732, 30 [Google Scholar]
- Perlmutter, S., Aldering, G., Goldhaber, G., et al. 1999, ApJ, 517, 565 [Google Scholar]
- Pessi, P. J., Durgesh, R., Nakazono, L., et al. 2024, A&A, 691, A181 [NASA ADS] [CrossRef] [EDP Sciences] [Google Scholar]
- Phillips, M. M., Wells, L. A., Suntzeff, N. B., et al. 1992, AJ, 103, 1632 [NASA ADS] [CrossRef] [Google Scholar]
- Phillips, M. M., Ashall, C., Brown, P. J., et al. 2024, ApJS, 273, 16 [NASA ADS] [CrossRef] [Google Scholar]
- Phillips, M. M., Uddin, S. A., Burns, C. R., et al. 2025, ArXiv e-prints [arXiv:2509.07093] [Google Scholar]
- Piro, A. L., & Morozova, V. S. 2016, ApJ, 826, 96 [NASA ADS] [CrossRef] [Google Scholar]
- Piro, A. L., & Nakar, E. 2013, ApJ, 769, 67 [NASA ADS] [CrossRef] [Google Scholar]
- Piro, A. L., & Nakar, E. 2014, ApJ, 784, 85 [NASA ADS] [CrossRef] [Google Scholar]
- Planck Collaboration XIII. 2016, A&A, 594, A13 [NASA ADS] [CrossRef] [EDP Sciences] [Google Scholar]
- Revaz, Y. 2023, A&A, 679, A2 [NASA ADS] [CrossRef] [EDP Sciences] [Google Scholar]
- Riess, A. G., Filippenko, A. V., Challis, P., et al. 1998, AJ, 116, 1009 [Google Scholar]
- Román, J., & Trujillo, I. 2017, MNRAS, 468, 703 [CrossRef] [Google Scholar]
- Rong, Y., Dong, X.-Y., Puzia, T. H., et al. 2020, ApJ, 899, 78 [NASA ADS] [CrossRef] [Google Scholar]
- Sand, D. J., Graham, M. L., Bildfell, C., et al. 2011, ApJ, 729, 142 [Google Scholar]
- Scalzo, R. A., Aldering, G., Antilogus, P., et al. 2010, ApJ, 713, 1073 [NASA ADS] [CrossRef] [Google Scholar]
- Scalzo, R. A., Parent, E., Burns, C., et al. 2019, MNRAS, 483, 628 [Google Scholar]
- Schlafly, E. F., & Finkbeiner, D. P. 2011, ApJ, 737, 103 [Google Scholar]
- Sharon, A., & Kushnir, D. 2020, MNRAS, 496, 4517 [CrossRef] [Google Scholar]
- Shingles, L., Smith, K. W., Young, D. R., et al. 2021, Transient Name Server AstroNote, 7, 1 [NASA ADS] [Google Scholar]
- Sifón, C., van der Burg, R. F. J., Hoekstra, H., Muzzin, A., & Herbonnet, R. 2018, MNRAS, 473, 3747 [Google Scholar]
- Silverman, J. M., & Filippenko, A. V. 2012, MNRAS, 425, 1917 [NASA ADS] [CrossRef] [Google Scholar]
- Simon, J. D. 2019, ARA&A, 57, 375 [NASA ADS] [CrossRef] [Google Scholar]
- Stritzinger, M., Leibundgut, B., Walch, S., & Contardo, G. 2006, A&A, 450, 241 [NASA ADS] [CrossRef] [EDP Sciences] [Google Scholar]
- Stritzinger, M., Burns, C. R., Phillips, M. M., et al. 2010, AJ, 140, 2036 [Google Scholar]
- Stritzinger, M. D., Shappee, B. J., Piro, A. L., et al. 2018, ApJ, 864, L35 [NASA ADS] [CrossRef] [Google Scholar]
- Strolger, L. G., Smith, R. C., Suntzeff, N. B., et al. 2002, AJ, 124, 2905 [Google Scholar]
- Strolger, L.-G., Bovill, M. S., Perlman, E., et al. 2025, ApJ, 988, 278 [Google Scholar]
- Sullivan, M., Le Borgne, D., Pritchet, C. J., et al. 2006, ApJ, 648, 868 [NASA ADS] [CrossRef] [Google Scholar]
- Taubenberger, S., Benetti, S., Childress, M., et al. 2011, MNRAS, 412, 2735 [NASA ADS] [CrossRef] [Google Scholar]
- Taubenberger, S., Kromer, M., Hachinger, S., et al. 2013, MNRAS, 432, 3117 [NASA ADS] [CrossRef] [Google Scholar]
- Terreran, G. 2021, Transient Name Server Classification Report, 2021-1007, 1 [Google Scholar]
- Tonry, J., & Davis, M. 1979, AJ, 84, 1511 [Google Scholar]
- Tonry, J. L., Denneau, L., Flewelling, H., et al. 2018a, ApJ, 867, 105 [NASA ADS] [CrossRef] [Google Scholar]
- Tonry, J. L., Denneau, L., Heinze, A. N., et al. 2018b, PASP, 130, 064505 [Google Scholar]
- Torrealba, G., Belokurov, V., Koposov, S. E., et al. 2019, MNRAS, 488, 2743 [NASA ADS] [CrossRef] [Google Scholar]
- Totani, T., Morokuma, T., Oda, T., Doi, M., & Yasuda, N. 2008, PASJ, 60, 1327 [NASA ADS] [CrossRef] [Google Scholar]
- van der Burg, R. F. J., Muzzin, A., & Hoekstra, H. 2016, A&A, 590, A20 [NASA ADS] [CrossRef] [EDP Sciences] [Google Scholar]
- van der Burg, R. F. J., Hoekstra, H., Muzzin, A., et al. 2017, A&A, 607, A79 [NASA ADS] [CrossRef] [EDP Sciences] [Google Scholar]
- van Dokkum, P. G., Abraham, R., Merritt, A., et al. 2015, ApJ, 798, L45 [NASA ADS] [CrossRef] [Google Scholar]
- Wang, X., & Loeb, A. 2018, New Astron., 61, 95 [CrossRef] [Google Scholar]
- Wang, X., Filippenko, A. V., Ganeshalingam, M., et al. 2009, ApJ, 699, L139 [NASA ADS] [CrossRef] [Google Scholar]
- Wenger, M., Ochsenbein, F., Egret, D., et al. 2000, A&AS, 143, 9 [NASA ADS] [CrossRef] [EDP Sciences] [Google Scholar]
- Willman, B., Blanton, M. R., West, A. A., et al. 2005, AJ, 129, 2692 [NASA ADS] [CrossRef] [Google Scholar]
- Yamanaka, M., Kawabata, K. S., Kinugasa, K., et al. 2009, ApJ, 707, L118 [NASA ADS] [CrossRef] [Google Scholar]
- Yu, Q., & Tremaine, S. 2003, ApJ, 599, 1129 [Google Scholar]
Appendix A: Broad-band Photometry of SN 2021hem
Optical and NIR broad-band photometry tables of SN 2021hem.
Optical photometry of SN 2021hem.
NIR photometry of SN 2021hem.
Appendix
 |
Fig. B.1. Intrinsic (B − V)0 color curve of SN 2021hem corrected only for Milky-Way reddening is shown, and is compared with normal SN Ia 2011fe, and low-luminosity SN Ia 1991bg. |
 |
Fig. B.2. Photometry region of the diffused extended feature at 4.2 kpc distance from SN location (yellow cross). The green polygon region is the aperture used for photometry, and the magenta polygon annulus represents the region for background estimation. The red contour represents the bright region of the feature used for estimating the surface brightness. |
Appendix C: Appendix C: Probabilistic multidimensional clustering analysis
As previously discussed in Sect. 4, SN 2021hem possesses many of the characteristics of 2003fg-like SNe discussed in Ashall et al. 2021, (see their Fig. 18). As shown there, most of the 2003fg-like objects are classified as “shallow-silicon” objects within the Branch scheme (Branch et al. 2006), with a couple objects classified as “core-normals”. Burrow et al. (2020) reformulate the Branch Diagram using Gaussian Mixture Models, providing a method by which to estimate the probability that any individual SN Ia belongs to each Branch group. Their clustering analysis also extended beyond the Branch Diagram phase space (i.e., pEW Si IIλ5972 vs. pEW Si IIλ6355) to include vSi II and MB in both three- and four-dimensional spaces. While the Branch groups are robust and tightly constrained even in higher-dimensional spaces, the groupings in these higher-dimensional spaces are by definition distinct from the original Branch groups.
Using the measurements from Ashall et al. (2021) and those of SN 2021hem determined in Sect. 4.2, we plot the traditional (e.g. two-dimensional) Branch diagram again in Fig. C.1. Because group membership is determined probabilistically, we find that all 2003fg-likes now belong to the “shallow-silicon” group, with a minimum membership probability of p > 0.79 (see Table C.1 for full probabilities). We find SN 2021hem is classified as a “core-normal” with p = 0.8526, significantly offset from the rest of the 2003fg-like sample. This is consistent with the placement of SN 2021hem in the sBV vs.  space defined in Ashall et al. (2021) where it sits outside the region of 2003fg-like SNe Ia.
Extending the above analysis to higher-dimensional spaces by including vSi II and MB in the GMM clustering requires addressing the uncertainties in both quantities associated with the seemingly hostless nature of SN 2021hem. We examine 3 cases: (1) assuming SN 2021hem lies at z = 0.0363 as adopted in the main body of the paper; (2) the runaway progenitor case, which assumes SN 2021hem is associated with 2MASX J16212572+1431537 at z = 0.02952; and (3) assuming z = 0.0363 but with larger uncertainties derived from propagating the redshift uncertainty as discussed in Sect. 3.4. We note that cases (1) and (2) consider only the measurement uncertainties associated with the Si II pEWs, vSi II, and MB. The results of this analysis are shown below in Fig. C.2 and Table C.2.
 |
Fig. C.1. Branch Diagram including SN 2021hem (assuming z = 0.0363), the sample of 2003fg-like SNe Ia from Ashall et al. (2021) over-plotted with the Burrow et al. (2020) sample. We note that both CSS140501 and SN 2012dn have both moved from the “core-normal” classifications assigned in Ashall et al. (2021) to the “shallow-silicon” groups here. See Table C.1 for the full probabilities, which correspond to the colorings of the overplotted points. |
Branch Group Membership Probabilities of 2003fg-like SNe Ia
We find that despite the overluminous nature of SN 2021hem, the inclusion of MB in both cases (1) and (3) changes the membership of SN 2021hem from the “core-normal”-equivalent group to the “cool”-equivalent group. The inclusion of vSi II causes the probabilities to shift 20% in the same direction without changing the group membership of SN 2021hem. Given the well-established association between underluminous, rapidly-declining SNe Ia and the “Cool” Branch group (Branch et al. 2006; Burrow et al. 2020; Phillips et al. 2025); the placement of the overluminous, slowly-declining SN 2021hem in the “cool” group is likely a reflection of the abnormal, hostless nature of SN 2021hem, but may hint at our incomplete understanding of 2003fg-like SNe Ia. This placement likely arises due to: (1) a tight clustering of the “core-normal” objects along the vSi II and MB axes, (2) an upper limit on pseudo-equivalent widths of the Si II lines for membership in the “shallow-silicon” group, and (3) the “broad-line” group being defined by high photospheric velocities to the point of being almost completely distinct from the other Branch groups in the higher-dimensional spaces (Burrow et al. 2020).
In case (2), we find that SN 2021hem is associated with the “core-normal”-equivalent group at p > 0.8 in all dimensionalities. SN 2021hem placement outside of the “shallow-silicon” (or equivalent) group in all cases and dimensionalities suggests that within this clustering scheme, its properties are significantly different than those expected for a 2003fg-like SNe Ia at z = 0.0363. Instead, this method of analysis, taken in combination with the location of SN 2021hem in the Ashall et al. (2020) classification, is more consistent with SN 2021hem being a overluminous “core-normal” SN Ia arising from the hypervelocity progenitor scenario discussed in Sect. 5.1. Because of the diversity of the 2003fg-like SNe Ia behavior and the hostless nature of SN 2021hem, however, these results should be evaluated in combination with other analyses and remembering the large uncertainties on all measurements.
 |
Fig. C.2. Multidimensional clusterings projected into the Branch Diagram phase-space for all combinations of input data and cluster dimensionality. The full probabilities associated with the group membership of SN 2021hem can be found in Table C.2. Numerical labels on the overplotted data are the same as in Fig. C.1. |
Multidimensional Branch group membership probabilities of SN 2021hem
All Tables
All Figures
|
Fig. 1. r-band image of SN 2021hem at peak brightness observed with the Nordic Optical Telescope. The location of SN 2021hem is positioned at the center in both panels. Two of the closest cataloged galaxies are marked in blue, both at the projected distance of roughly 100 kpc (see Sect. 5.1). |
| In the text | |
|
Fig. 2. Large-scale structure around the position of SN 2021hem (marked with a cyan cross) shown in a field with a size of 2 × 2 square degrees (DSS image). The colored circles indicate the galaxies with measured redshifts from the SIMBAD catalog within a redshift range of 0.02 to 0.05. The color bar indicates the redshifts for each color. There appears to be an overdensity of galaxies with redshifts close to z ≈ 0.027, ≈0.035 within a radius of 1 Mpc from the position of the SN. The open star symbol corresponds to the AGN galaxy 2MASX J16212572+1431537, which lies at a projected distance of 104 kpc from the SN. |
| In the text | |
|
Fig. 3. Optical and NIR light curves of SN 2021hem, shown alongside the best-fit SNooPy template light curves using the max_model. Our own observations are shown with filled circles, and the photometry from ZTF, YSE, and ATLAS surveys is shown in different symbols. The SNooPy template fits are overplotted as solid lines; those in the gri bands are derived specifically from fits to the ZTF photometry. The indicated offsets have been added to the light curves for clarity. The vertical dashed line corresponds to the estimated “time of first light” by fitting a “fireball” model (see Sect. 4.1.2). |
| In the text | |
|
Fig. 4. Markov chain Monte Carlo power-law model fit to ZTF g and r-band fluxes to estimate the time of first light tfirst. The fitting is limited to the first 12 days after tfirst, during which the light curve clearly follows a power-law rise. Power-law model fits are performed separately on the ZTF g- and r-band light curves to determine tfirst and α independently for each band. In the top panel, the g- and r-band fluxes are shown with arbitrary and distinct scales for visual clarity. The inferred (weighted mean) tfirst is shown by a vertical dashed line, with the shaded region indicating the uncertainty limits. In the bottom panels, the vertical and horizontal lines indicate the tfirst and α values, as inferred from each MCMC fit. |
| In the text | |
|
Fig. 5. UVOIR bolometric light curve of SN 2021hem fit with a radioactive 56Ni decay model. The time of explosion is taken as the epoch of first detection, which is ≈17.9 days before the B-band maximum. Only data beyond 60 days were used to fit the model. The UVOIR light curve of SN 2021hem (top panel), its time-weighted integrated luminosity (middle panel), and the ratio t2L/(∫Lt dt) (bottom panel), which is defined independently of the 56Ni mass, are shown. |
| In the text | |
|
Fig. 6. Optical spectra of SN 2021hem from −10.2 days to +33.8 days relative to the epoch of B-band maximum. Spectra are shifted by arbitrary constants for clarity. Telluric absorption features are marked by dashed lines and labeled with the crossed circles. |
| In the text | |
|
Fig. 7. Comparison of similar-phase spectra of the normal SN 2013gy and SN 2021hem. Telluric absorption features are marked by dashed lines and labeled with telluric symbols. Prominent spectral features in the pre-maximum light spectra are labeled. |
| In the text | |
|
Fig. 8. Si IIλ6355 velocity evolution of SN 2021hem compared with the evolutions of other 2003fg-like SNe Ia. |
| In the text | |
|
Fig. 9. −0.5 d NIR spectrum of SN 2021hem obtained with the NASA IRFT telescope equipped with SpeX. The prominent identified lines are labeled. The vertical red, green, and blue lines mark the positions for O I, Mg II, and C I lines respectively, where all lines for a given atomic species are at the same velocity. The O I (red) λ0.7774, λ0.9266 μm lines are at 10 500 km s−1, Mg II (green) λλ0.9218, 0.9244, λ0.9632, λ1.0092, λ1.0927 μm lines are at 11 700 km s−1, and C I (blue) λ0.9093, λ0.9406, λ1.0693, λ1.1754 μm lines are at 12 500 km s−1. Strong lines of Mg II and O I are identified, whereas for C I no prominent line identification is found, the C I line positions are shown at a tentative velocity of ≈12 500 km s−1. |
| In the text | |
|
Fig. 10. Image cutout centered on the position of SN 2021hem, taken on 9 September 2023 with the GTC equipped with OSIRIS. The final image is a stack of eight individual exposures, with a total integration time of 435 seconds. The location of the SN and the nearby diffuse extended feature is marked. An isophote is shown (green contour) enclosing the diffuse feature. |
| In the text | |
|
Fig. 11. Left: Detection efficiency as a function of magnitude with a 3σ detection threshold. Each curve is based on 30 000 simulated images, generated by adding an artificial star drawn from a uniform distribution over the magnitude range and within a 4 ⋅ FWHM square region around the SN position. The different curves correspond to varying tolerances between the recovered flux and the true flux of the input star. A detection is counted as successful if the recovered flux lies within the specified tolerance level of the input artificial star. Right: Same as left panel, but using 1σ detection threshold and 50 000 simulations within a magnitude range of 21.75 to 25.75 mag. |
| In the text | |
|
Fig. B.1. Intrinsic (B − V)0 color curve of SN 2021hem corrected only for Milky-Way reddening is shown, and is compared with normal SN Ia 2011fe, and low-luminosity SN Ia 1991bg. |
| In the text | |
|
Fig. B.2. Photometry region of the diffused extended feature at 4.2 kpc distance from SN location (yellow cross). The green polygon region is the aperture used for photometry, and the magenta polygon annulus represents the region for background estimation. The red contour represents the bright region of the feature used for estimating the surface brightness. |
| In the text | |
|
Fig. C.1. Branch Diagram including SN 2021hem (assuming z = 0.0363), the sample of 2003fg-like SNe Ia from Ashall et al. (2021) over-plotted with the Burrow et al. (2020) sample. We note that both CSS140501 and SN 2012dn have both moved from the “core-normal” classifications assigned in Ashall et al. (2021) to the “shallow-silicon” groups here. See Table C.1 for the full probabilities, which correspond to the colorings of the overplotted points. |
| In the text | |
|
Fig. C.2. Multidimensional clusterings projected into the Branch Diagram phase-space for all combinations of input data and cluster dimensionality. The full probabilities associated with the group membership of SN 2021hem can be found in Table C.2. Numerical labels on the overplotted data are the same as in Fig. C.1. |
| In the text | |
Current usage metrics show cumulative count of Article Views (full-text article views including HTML views, PDF and ePub downloads, according to the available data) and Abstracts Views on Vision4Press platform.
Data correspond to usage on the plateform after 2015. The current usage metrics is available 48-96 hours after online publication and is updated daily on week days.
Initial download of the metrics may take a while.