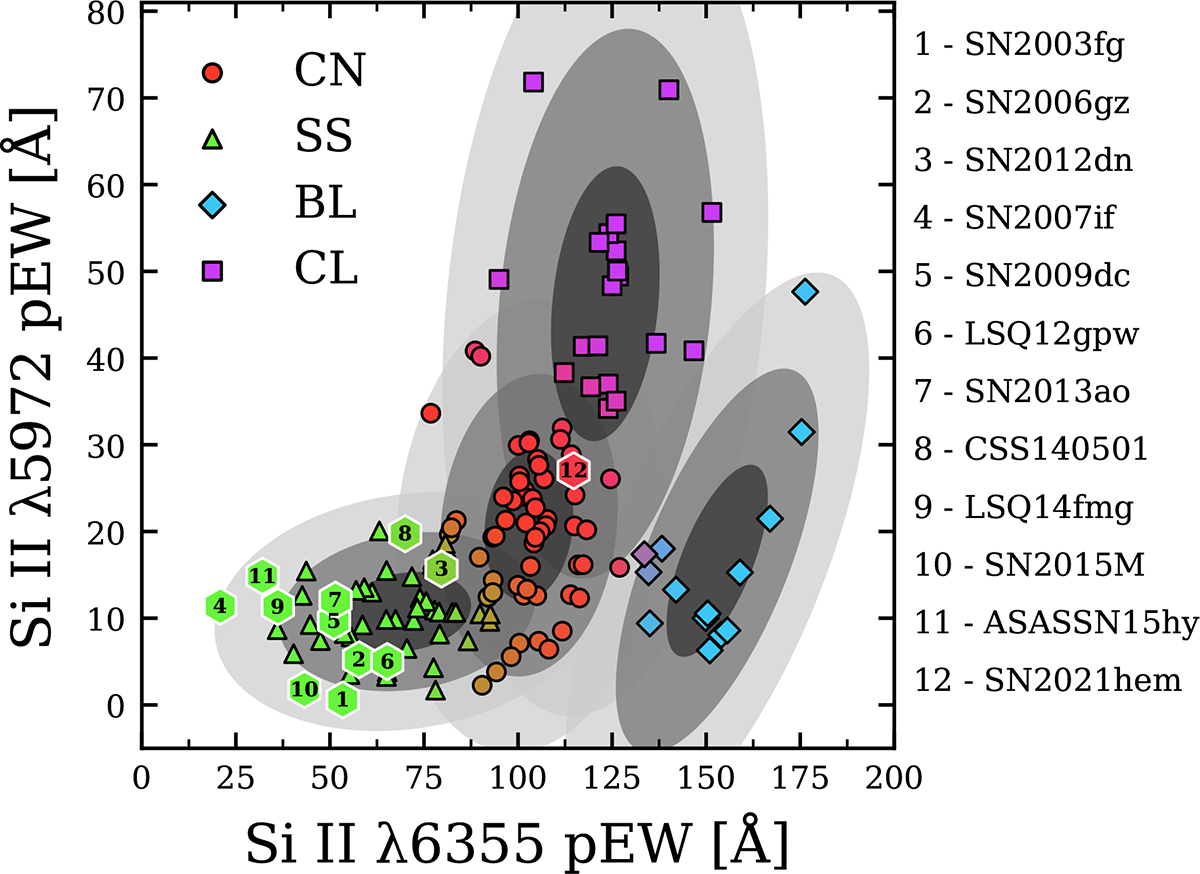
Fig. C.1.
Download original image
Branch Diagram including SN 2021hem (assuming z = 0.0363), the sample of 2003fg-like SNe Ia from Ashall et al. (2021) over-plotted with the Burrow et al. (2020) sample. We note that both CSS140501 and SN 2012dn have both moved from the “core-normal” classifications assigned in Ashall et al. (2021) to the “shallow-silicon” groups here. See Table C.1 for the full probabilities, which correspond to the colorings of the overplotted points.
Current usage metrics show cumulative count of Article Views (full-text article views including HTML views, PDF and ePub downloads, according to the available data) and Abstracts Views on Vision4Press platform.
Data correspond to usage on the plateform after 2015. The current usage metrics is available 48-96 hours after online publication and is updated daily on week days.
Initial download of the metrics may take a while.