Fig. 3.
Download original image
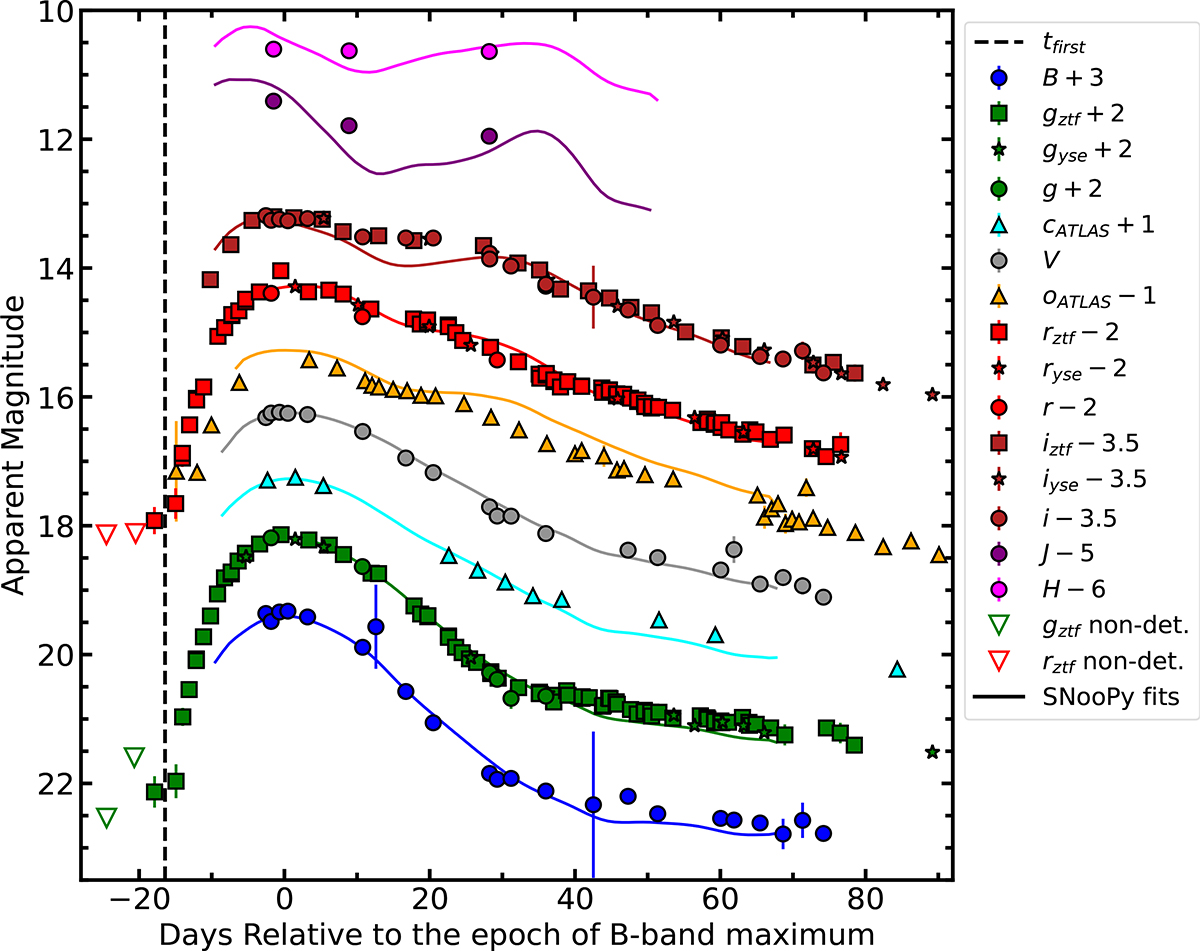
Optical and NIR light curves of SN 2021hem, shown alongside the best-fit SNooPy template light curves using the max_model. Our own observations are shown with filled circles, and the photometry from ZTF, YSE, and ATLAS surveys is shown in different symbols. The SNooPy template fits are overplotted as solid lines; those in the gri bands are derived specifically from fits to the ZTF photometry. The indicated offsets have been added to the light curves for clarity. The vertical dashed line corresponds to the estimated “time of first light” by fitting a “fireball” model (see Sect. 4.1.2).
Current usage metrics show cumulative count of Article Views (full-text article views including HTML views, PDF and ePub downloads, according to the available data) and Abstracts Views on Vision4Press platform.
Data correspond to usage on the plateform after 2015. The current usage metrics is available 48-96 hours after online publication and is updated daily on week days.
Initial download of the metrics may take a while.