Fig. 9.
Download original image
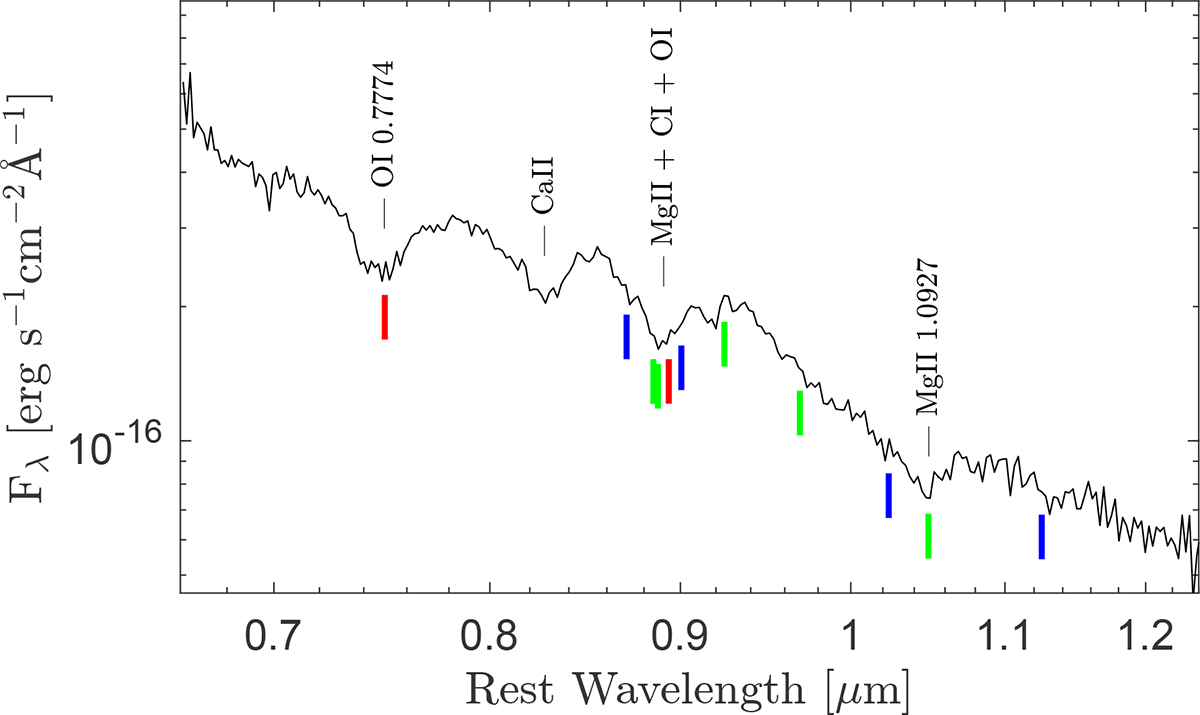
−0.5 d NIR spectrum of SN 2021hem obtained with the NASA IRFT telescope equipped with SpeX. The prominent identified lines are labeled. The vertical red, green, and blue lines mark the positions for O I, Mg II, and C I lines respectively, where all lines for a given atomic species are at the same velocity. The O I (red) λ0.7774, λ0.9266 μm lines are at 10 500 km s−1, Mg II (green) λλ0.9218, 0.9244, λ0.9632, λ1.0092, λ1.0927 μm lines are at 11 700 km s−1, and C I (blue) λ0.9093, λ0.9406, λ1.0693, λ1.1754 μm lines are at 12 500 km s−1. Strong lines of Mg II and O I are identified, whereas for C I no prominent line identification is found, the C I line positions are shown at a tentative velocity of ≈12 500 km s−1.
Current usage metrics show cumulative count of Article Views (full-text article views including HTML views, PDF and ePub downloads, according to the available data) and Abstracts Views on Vision4Press platform.
Data correspond to usage on the plateform after 2015. The current usage metrics is available 48-96 hours after online publication and is updated daily on week days.
Initial download of the metrics may take a while.