Fig. 10
Download original image
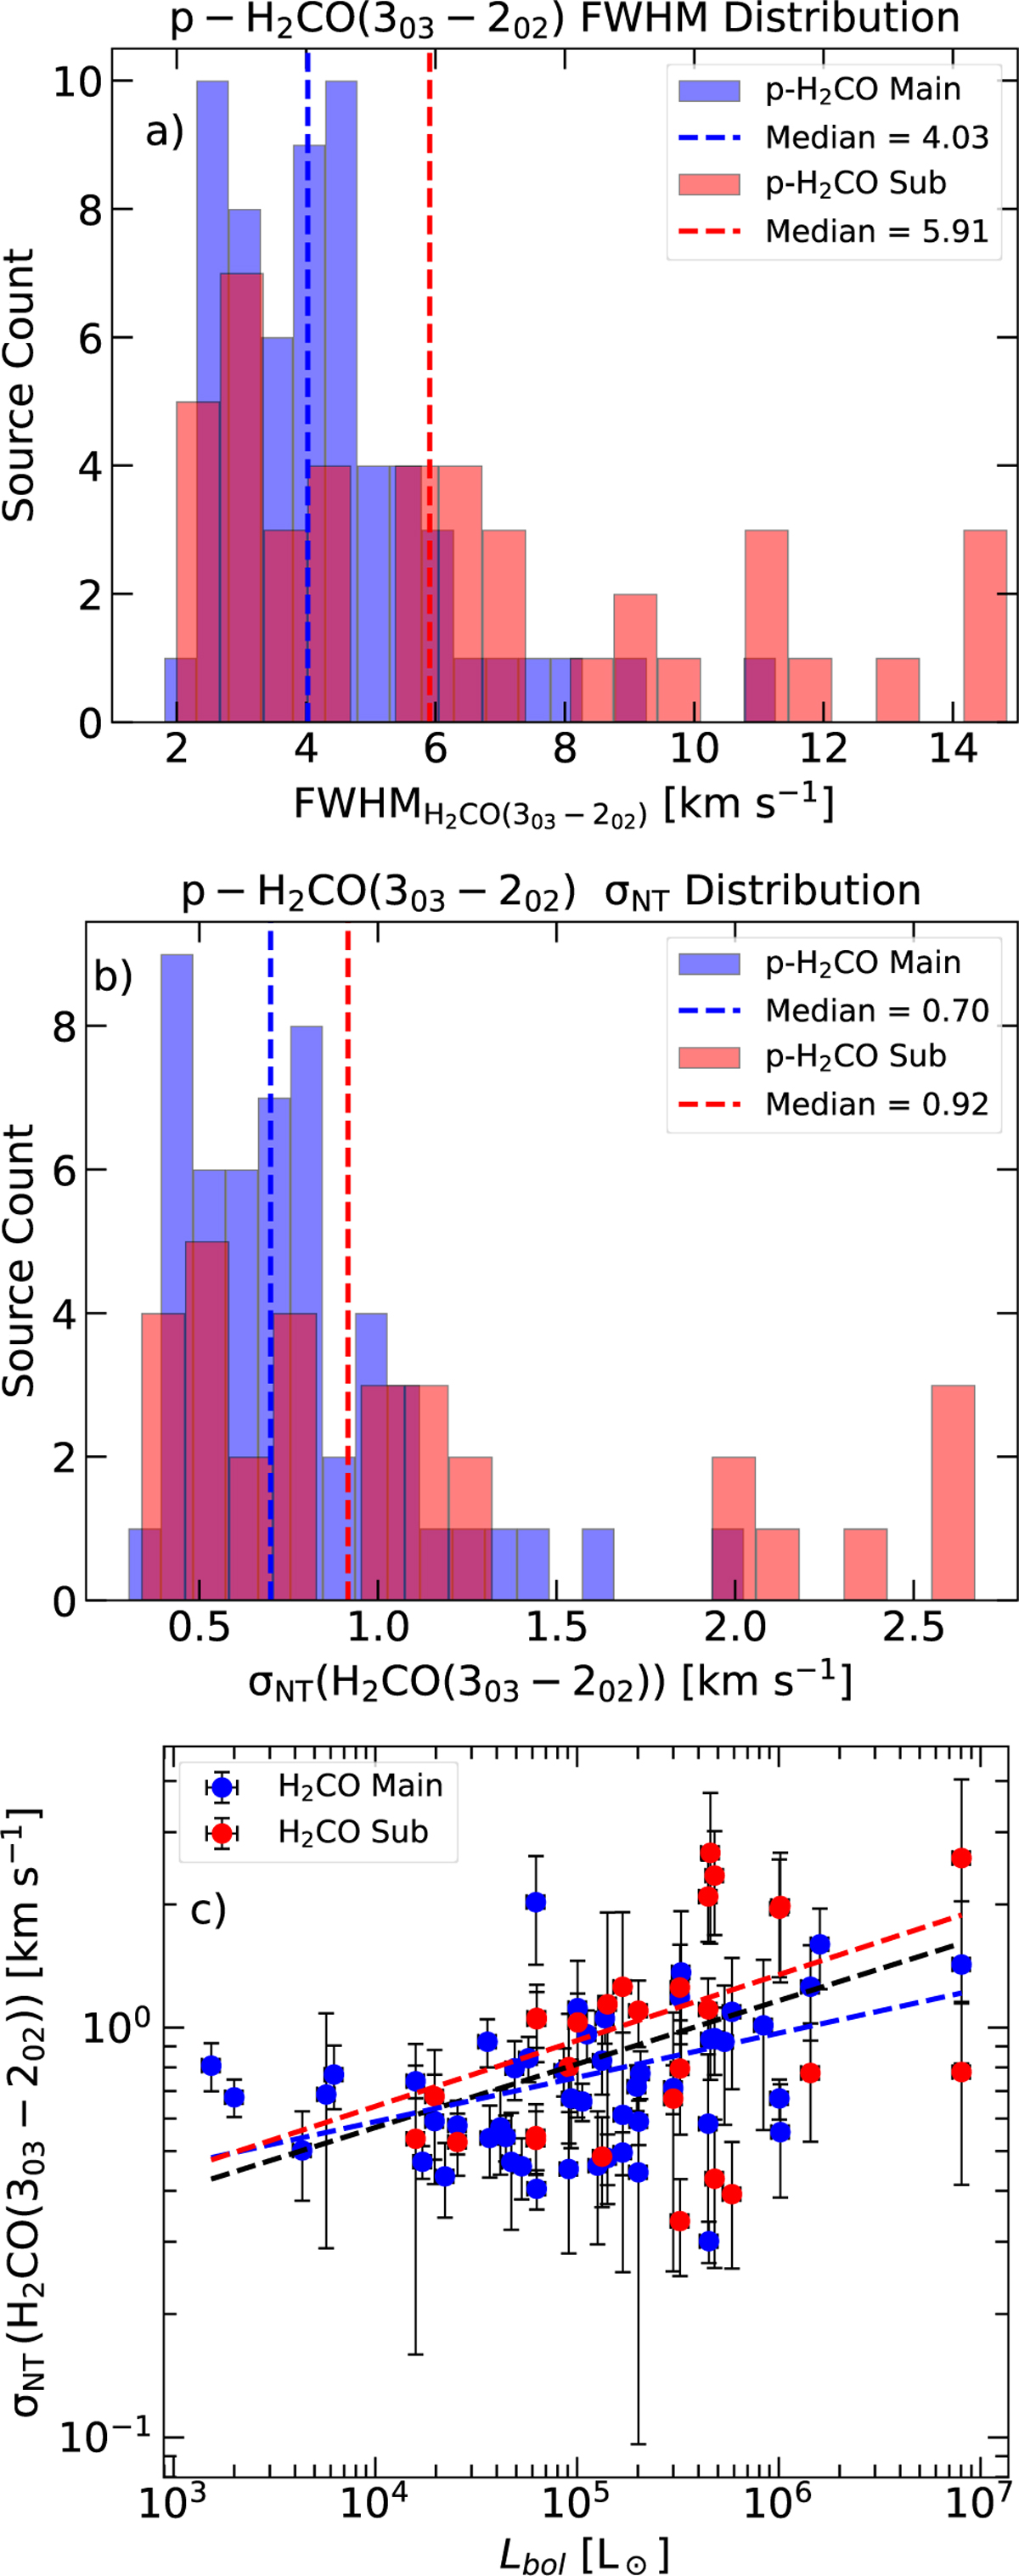
Distributions of (a) FWHM and (b) σNT of the p–H2CO (30,3–20,2) transition. The blue and red histograms represent the H2CO Main and H2CO Sub components, respectively, with the corresponding dashed lines marking their median values. Panel c: relation between σNT and Lbol. The black, blue, and red dashed lines indicate the power-law fits for all components combined, the Main components, and the Sub components, respectively.
Current usage metrics show cumulative count of Article Views (full-text article views including HTML views, PDF and ePub downloads, according to the available data) and Abstracts Views on Vision4Press platform.
Data correspond to usage on the plateform after 2015. The current usage metrics is available 48-96 hours after online publication and is updated daily on week days.
Initial download of the metrics may take a while.