Fig. 11
Download original image
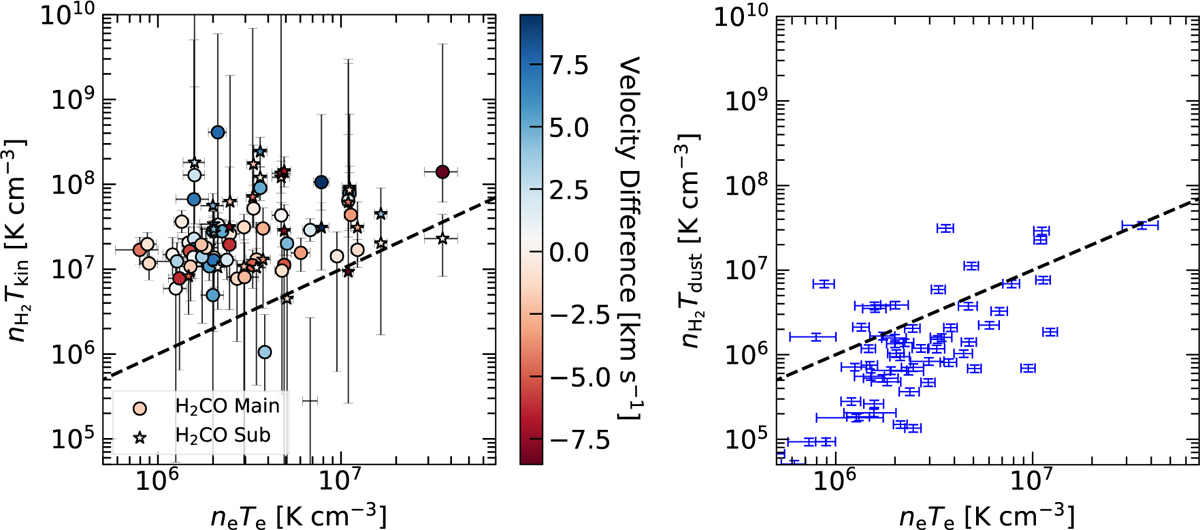
Comparison between the thermal pressure of ionized and molecular gas. The color bar indicates the velocity difference between the RRL and p–H2CO transitions. Left panel: n(H2) and Tkin derived from p–H2CO in this work. Right panel: n(H2) and Tdust estimated from the 870 μm emission (Urquhart et al. 2018, 2022), representing the average clump pressure. The dashed black lines mark the slope of equal pressure. The plots are set to the same scale for visual comparison.
Current usage metrics show cumulative count of Article Views (full-text article views including HTML views, PDF and ePub downloads, according to the available data) and Abstracts Views on Vision4Press platform.
Data correspond to usage on the plateform after 2015. The current usage metrics is available 48-96 hours after online publication and is updated daily on week days.
Initial download of the metrics may take a while.