Fig. A.4
Download original image
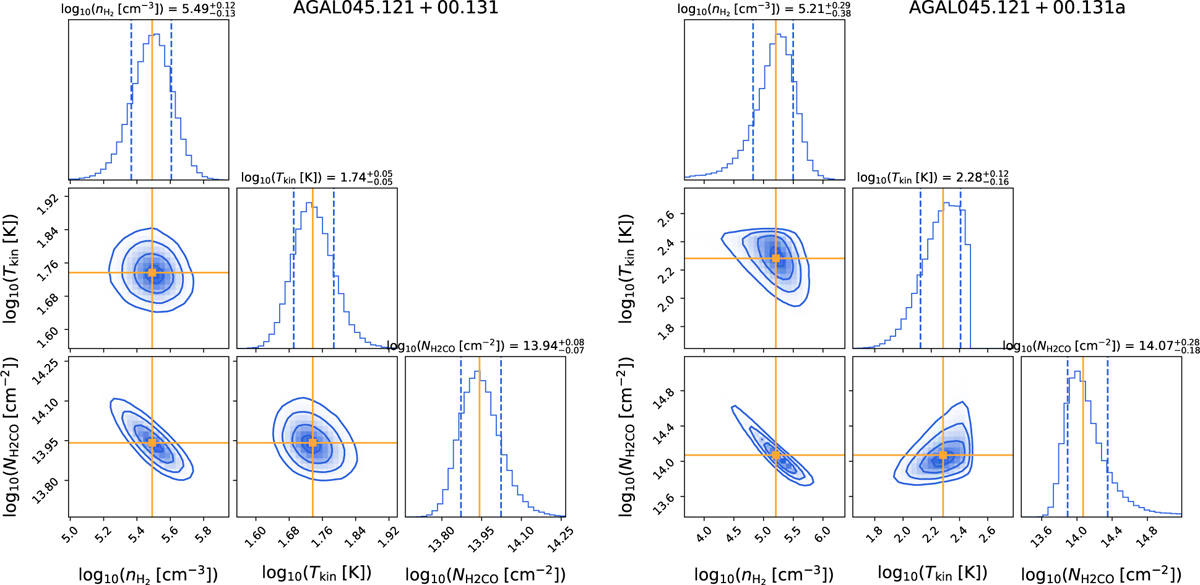
Example corner plot for AGAL045.121+00.131. To constrain physical properties of the molecular clouds we used the non-LTE RADEX modelling with MCMC algorithm, here we show the corresponding corner plot for each Gaussian component displaying the 1D histogram of the posterior distribution for each parameter (kinetic temperature, Tkin, H2 density, n(H2), and p–H2CO column density, N(p–H2CO)). The histograms represent the PDFs of the Monte Carlo fit parameters, while the blue curves represent the scatter plot of the joint distribution between the two parameters. The orange solid lines indicate the median of the PDFs, representing the most likely fit parameters, and the dotted blue lines correspond to the 1σ confidence intervals. The subtitle of each corner plot shows most likely value of the parameters with upper and lower 1σ error.
Current usage metrics show cumulative count of Article Views (full-text article views including HTML views, PDF and ePub downloads, according to the available data) and Abstracts Views on Vision4Press platform.
Data correspond to usage on the plateform after 2015. The current usage metrics is available 48-96 hours after online publication and is updated daily on week days.
Initial download of the metrics may take a while.