Fig. D.1
Download original image
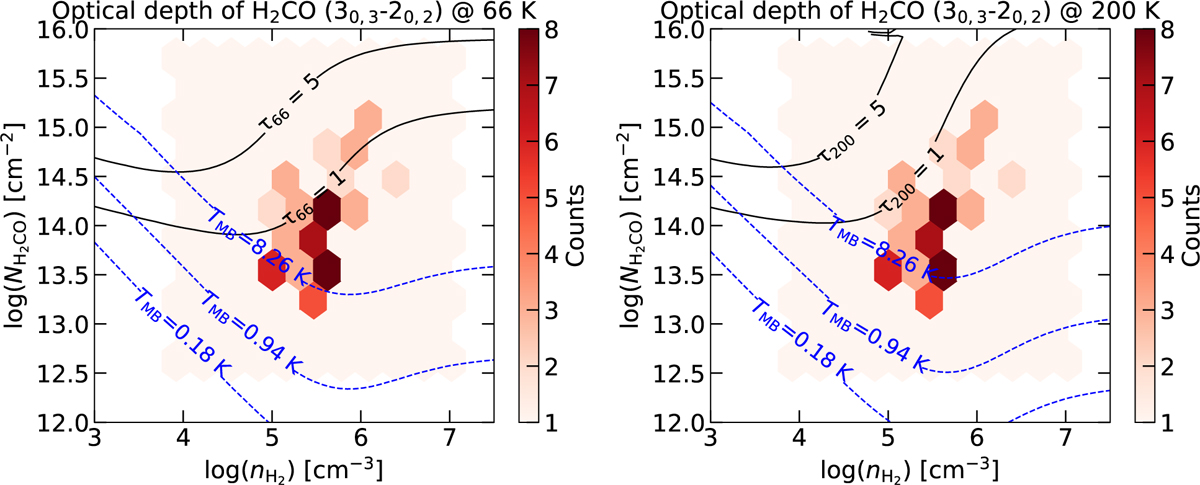
Optical depth of p–H2CO (30,3–20,2) as a function of n(H2)-N(p–H2CO) for a fix value of Tkin. The color hexagonally binned distributions display the PyRADEX+MCMC constrained n(H2) and N(p–H2CO) of our sources. The black solid curves show the optical depth of τ = 1 and 5 for p–H2CO (30,3–20,2) transition on top of n(H2) and N(p–H2CO) space, assuming fixed kinetic temperature of 66 K (the median temperature of our sample; left panel) and 200 K (higher temperature; right panel). The blue dashed curves indicate the contour corresponding to the brightest, average, and faintest observed intensities for p–H2CO (30,3–20,2) transition (see the text).
Current usage metrics show cumulative count of Article Views (full-text article views including HTML views, PDF and ePub downloads, according to the available data) and Abstracts Views on Vision4Press platform.
Data correspond to usage on the plateform after 2015. The current usage metrics is available 48-96 hours after online publication and is updated daily on week days.
Initial download of the metrics may take a while.