Open Access
Fig. 3
Download original image
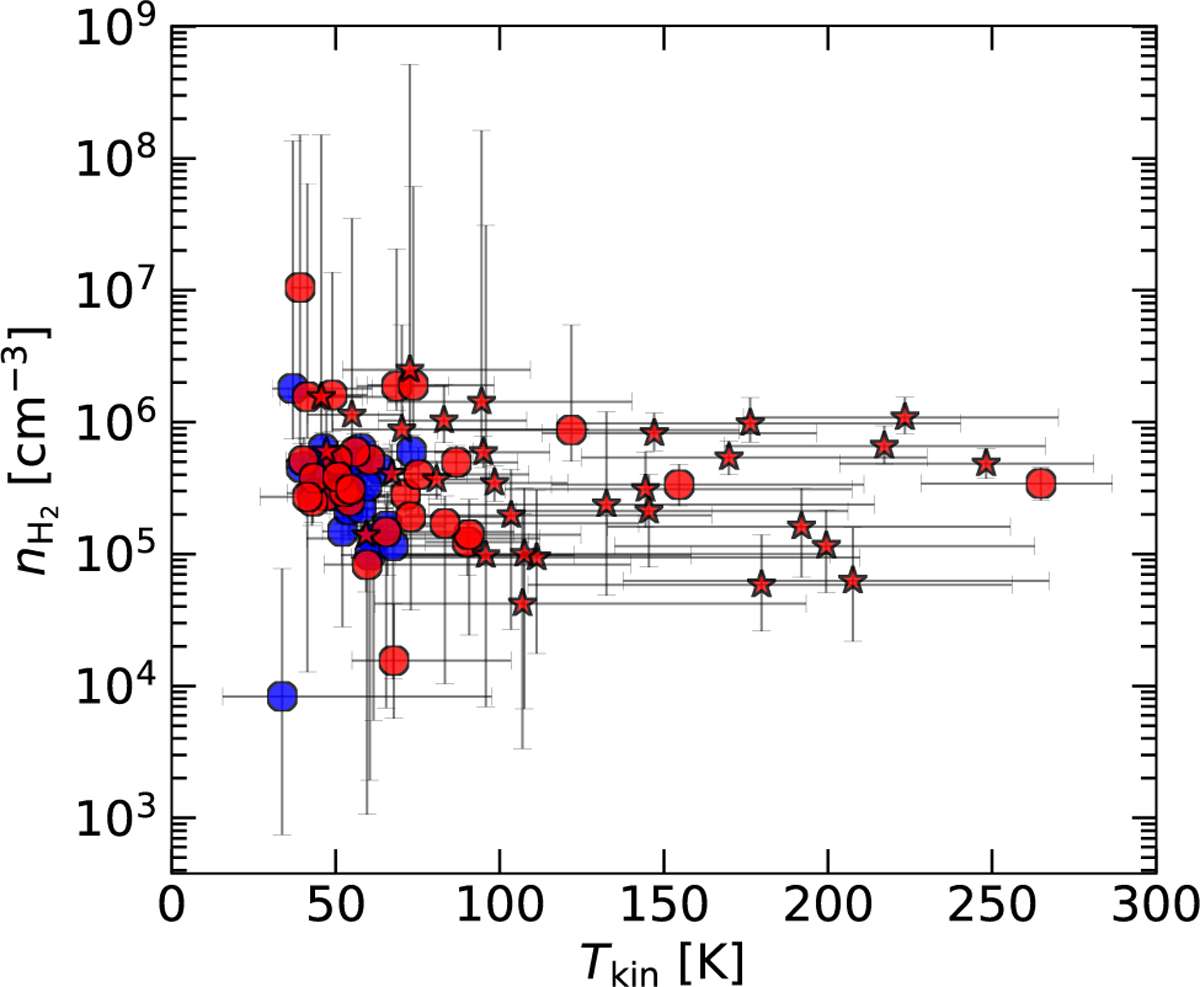
Distribution of the sources in the n(H2)–Tkin plane. The blue and red colors respectively represent sources with single and multiple component Gaussian profiles. Filled circles denote components classified as “H2CO Main,” while stars indicate those identified as “H2CO Sub.”
Current usage metrics show cumulative count of Article Views (full-text article views including HTML views, PDF and ePub downloads, according to the available data) and Abstracts Views on Vision4Press platform.
Data correspond to usage on the plateform after 2015. The current usage metrics is available 48-96 hours after online publication and is updated daily on week days.
Initial download of the metrics may take a while.