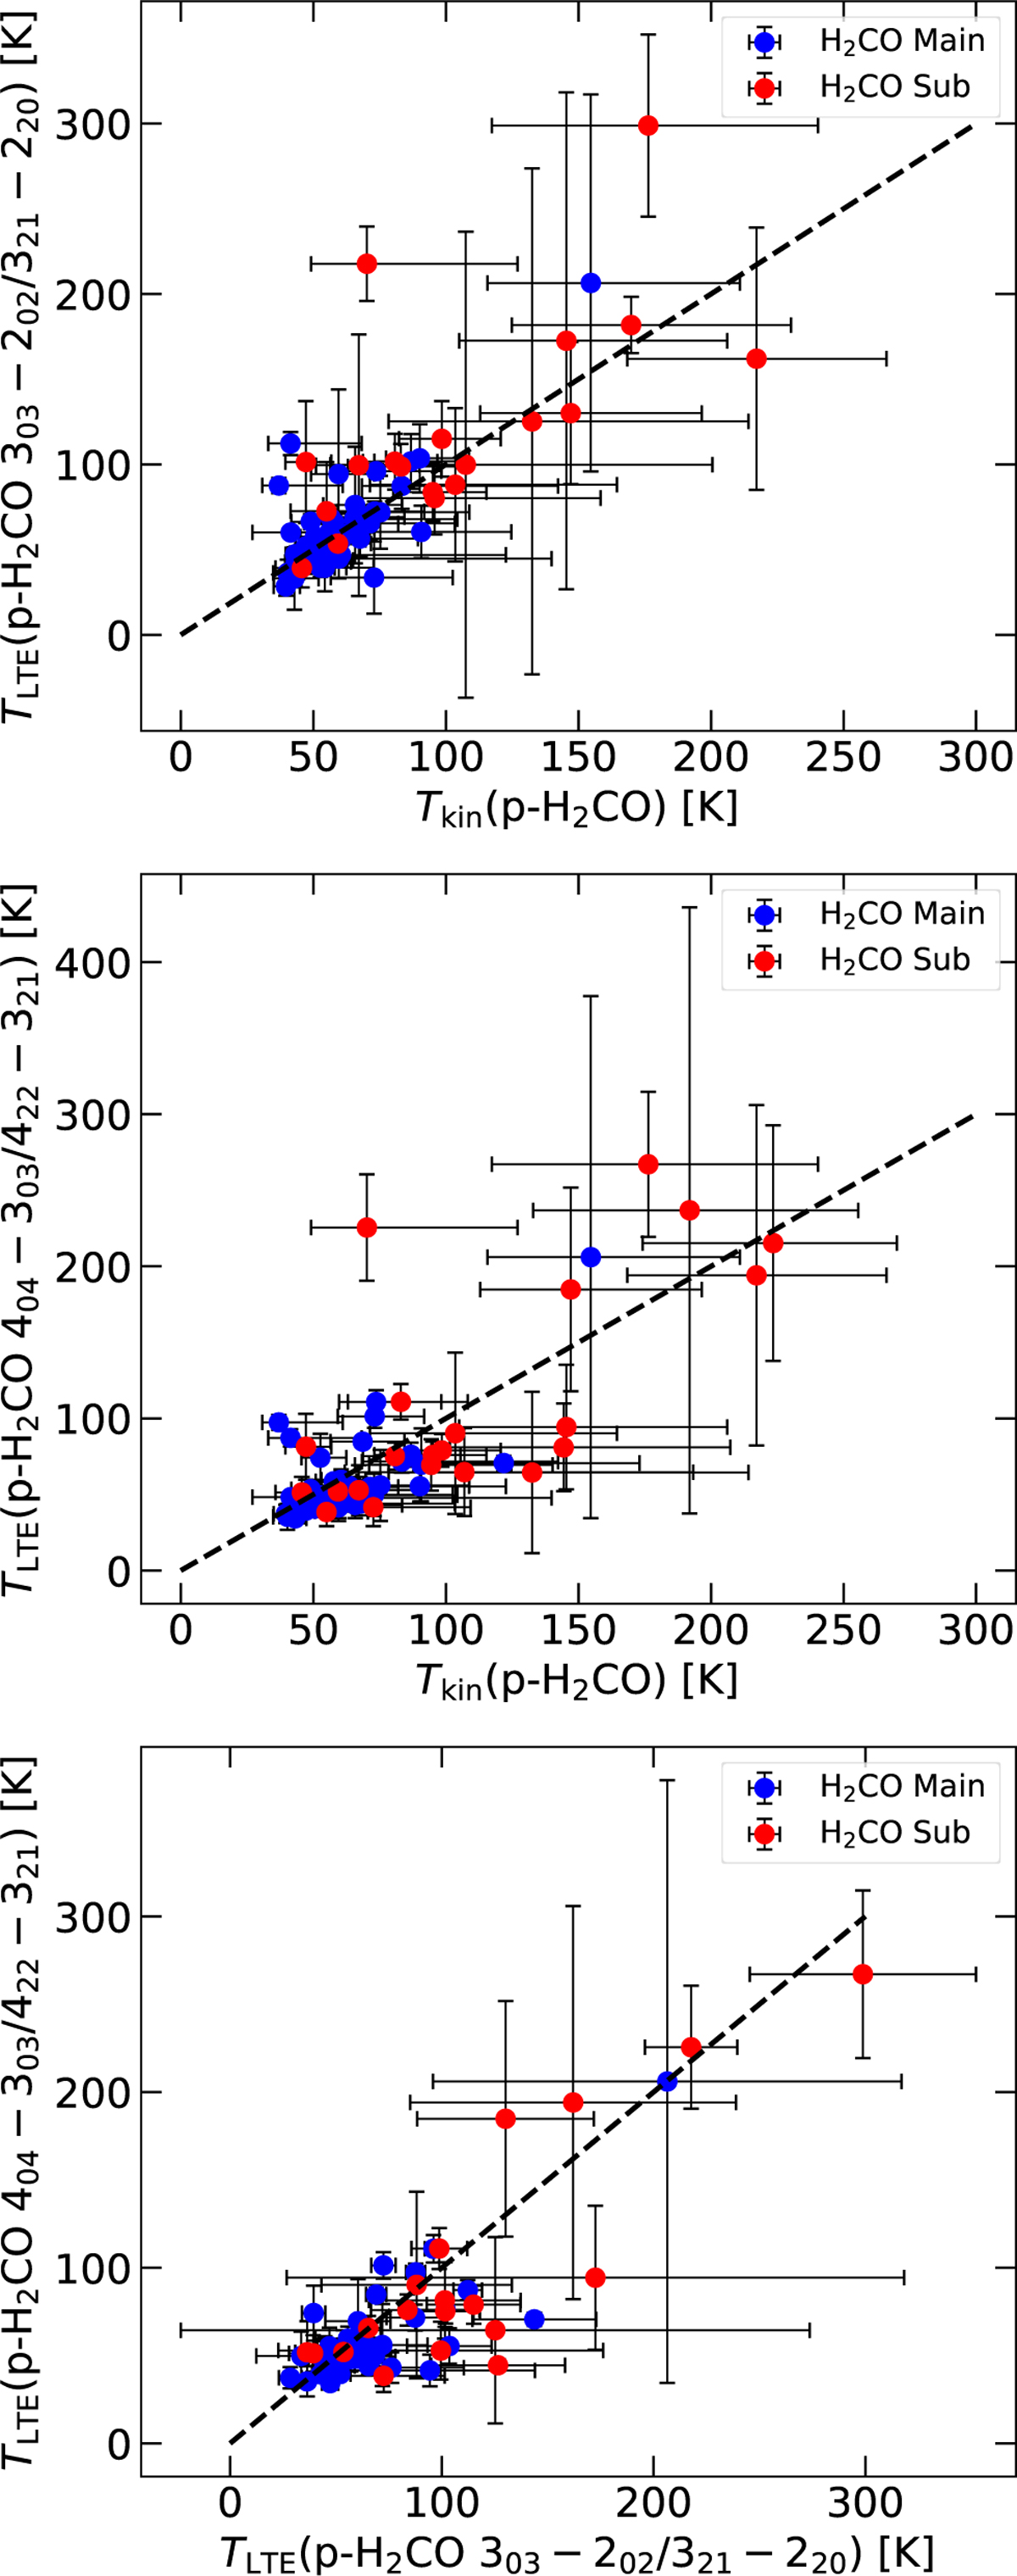
Fig. 6
Download original image
Comparison between the kinetic temperatures derived from pyRADEX+MCMC modeling and using the p–H2CO integrated line intensities ratios R1 (top panel) and R2 (middle panel). Bottom panel: comparison of the kinetic temperatures derived from R1 and R2. The LTE temperature uncertainties are from uncertainties in the integrated intensities of the observed p–H2CO lines. The dashed black lines indicate a slope of unity.
Current usage metrics show cumulative count of Article Views (full-text article views including HTML views, PDF and ePub downloads, according to the available data) and Abstracts Views on Vision4Press platform.
Data correspond to usage on the plateform after 2015. The current usage metrics is available 48-96 hours after online publication and is updated daily on week days.
Initial download of the metrics may take a while.